Projects
Professional Projects
Unfortunetly due to the nature of my current job there are no references to my job at the unclassified level to share.
Education Projects
While attending Boston University I have completed a few assignments that can be accessed via the linked provided. These were with the assistance of my professor and the lessons for the courses, but all documentation is attached to the attached GitHubs.
Cloud Analytics for Business
Assignment 2
Assignment 2
Assignment description: This assignment was about sorting through data to look for key indicators such as average salary, monthly job posting trends in specific states, identifying specific companies that were hiring for remote jobs, and looking at median salary trends among other activities. These charts highlight the work that was done to accomplish some of these goals. Not only did we isolate the variables of salary, companies , remote work, and occupation, but we were also able to lay out the data in a readable and digestible way for a consumer that would be valuable for someone looking to enter the job market or gain insight into things such as the biggest remote working companies or what the average median pay could be for these types of jobs. This data could be sorted even further as this was just a baseline for the data.
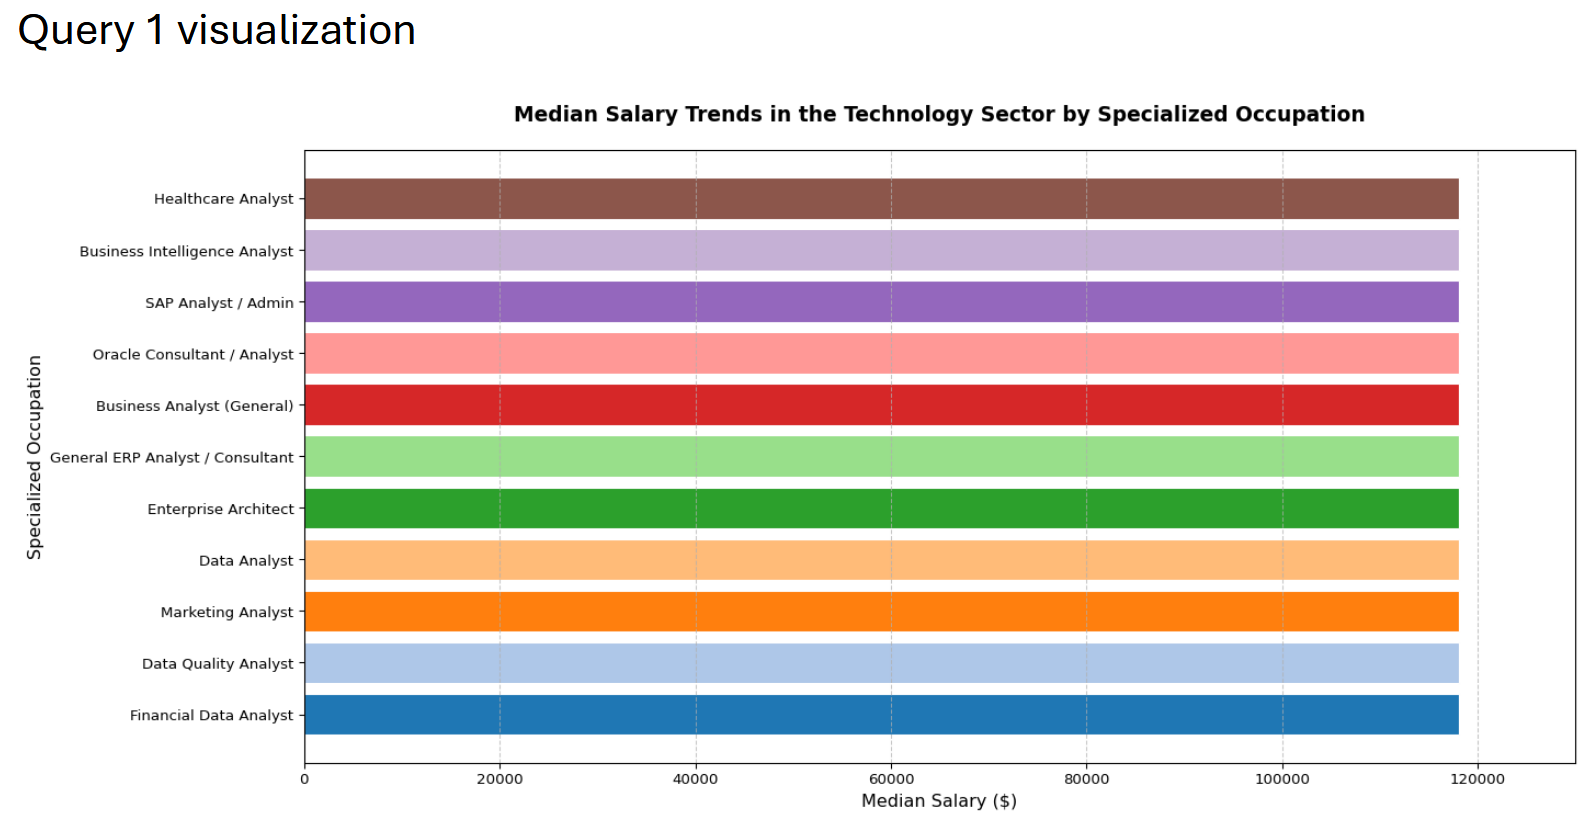
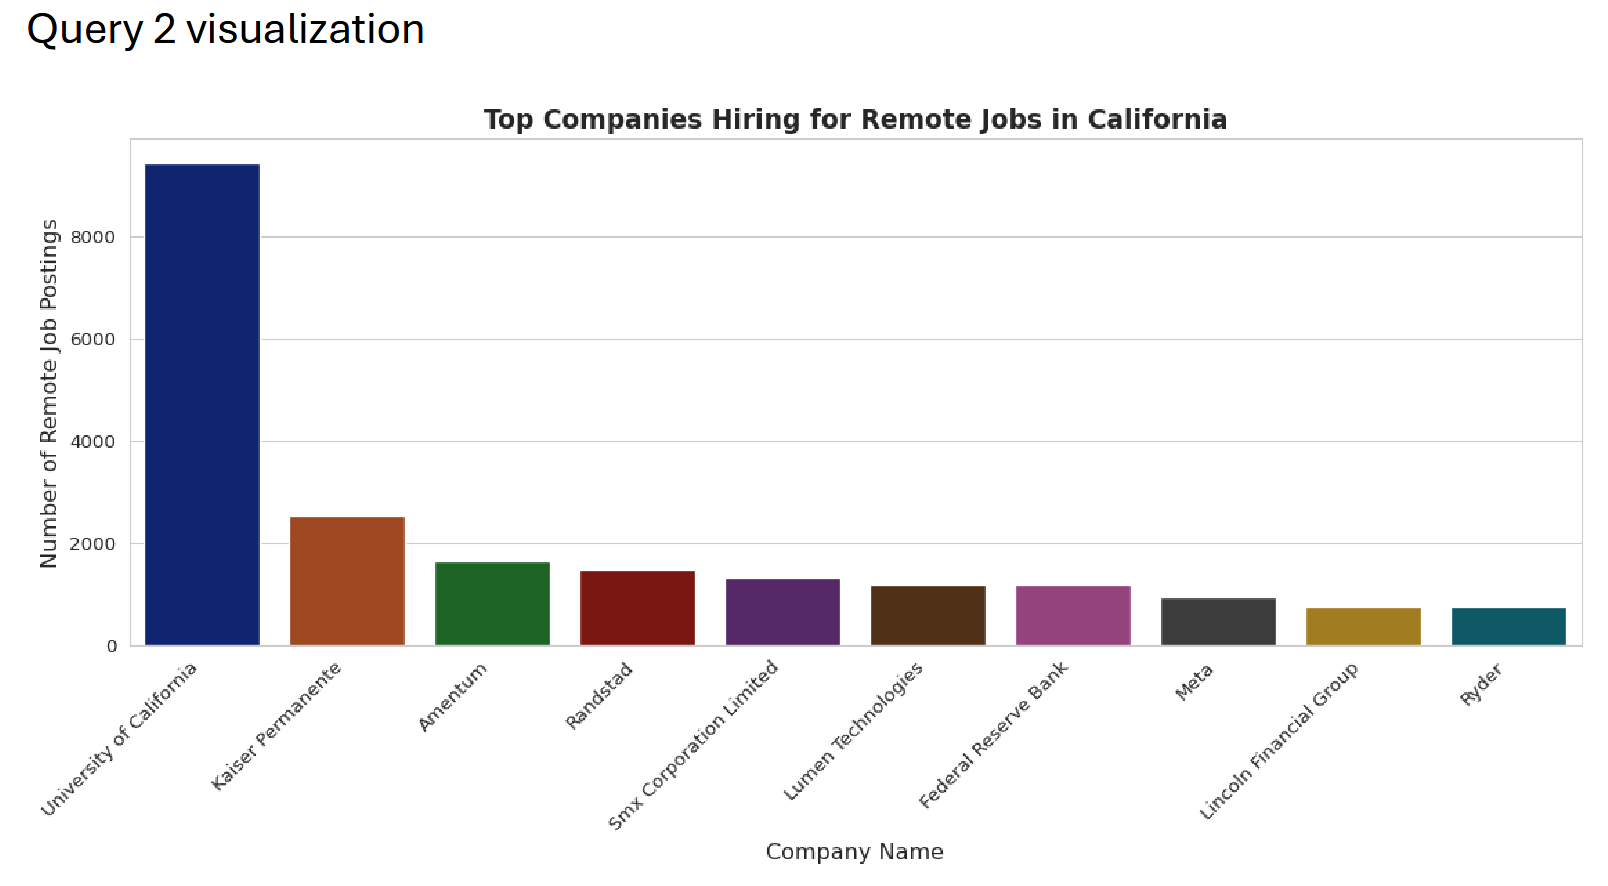
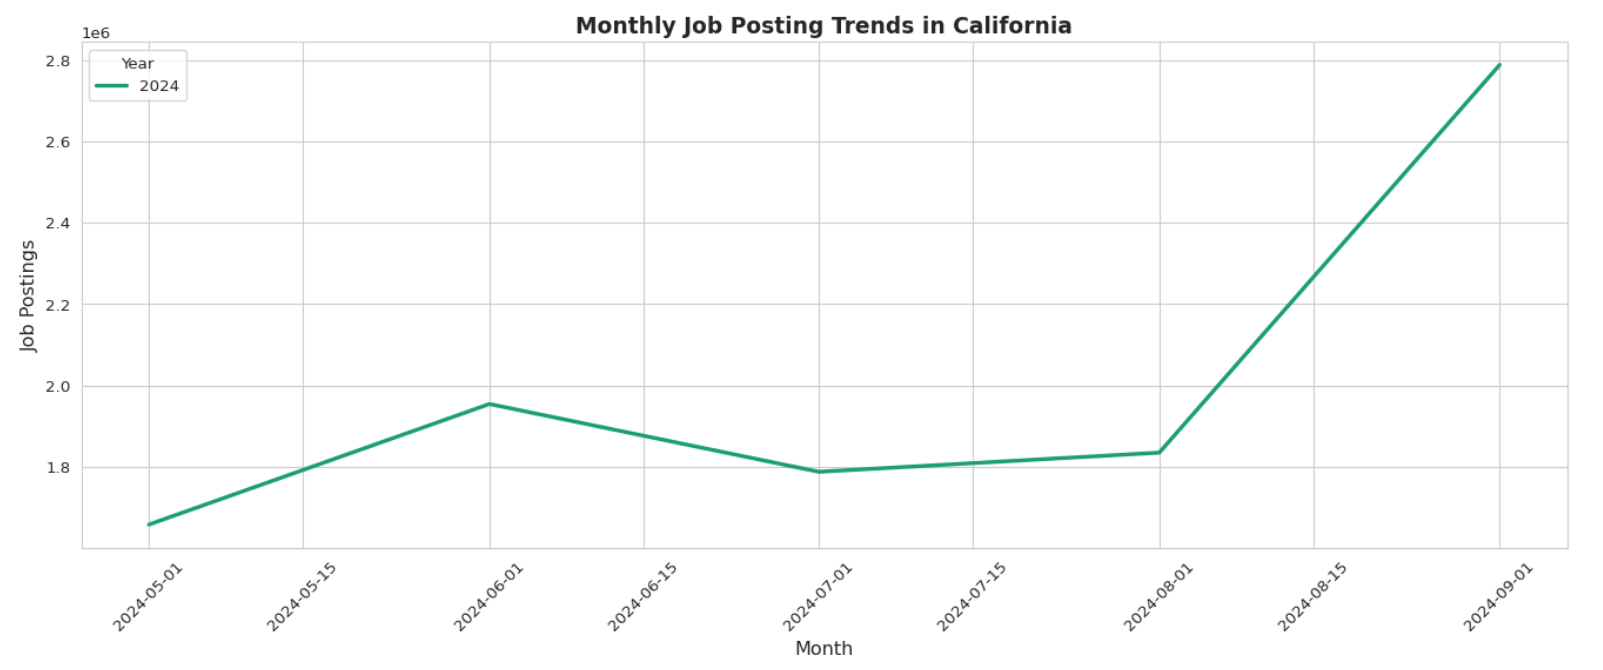
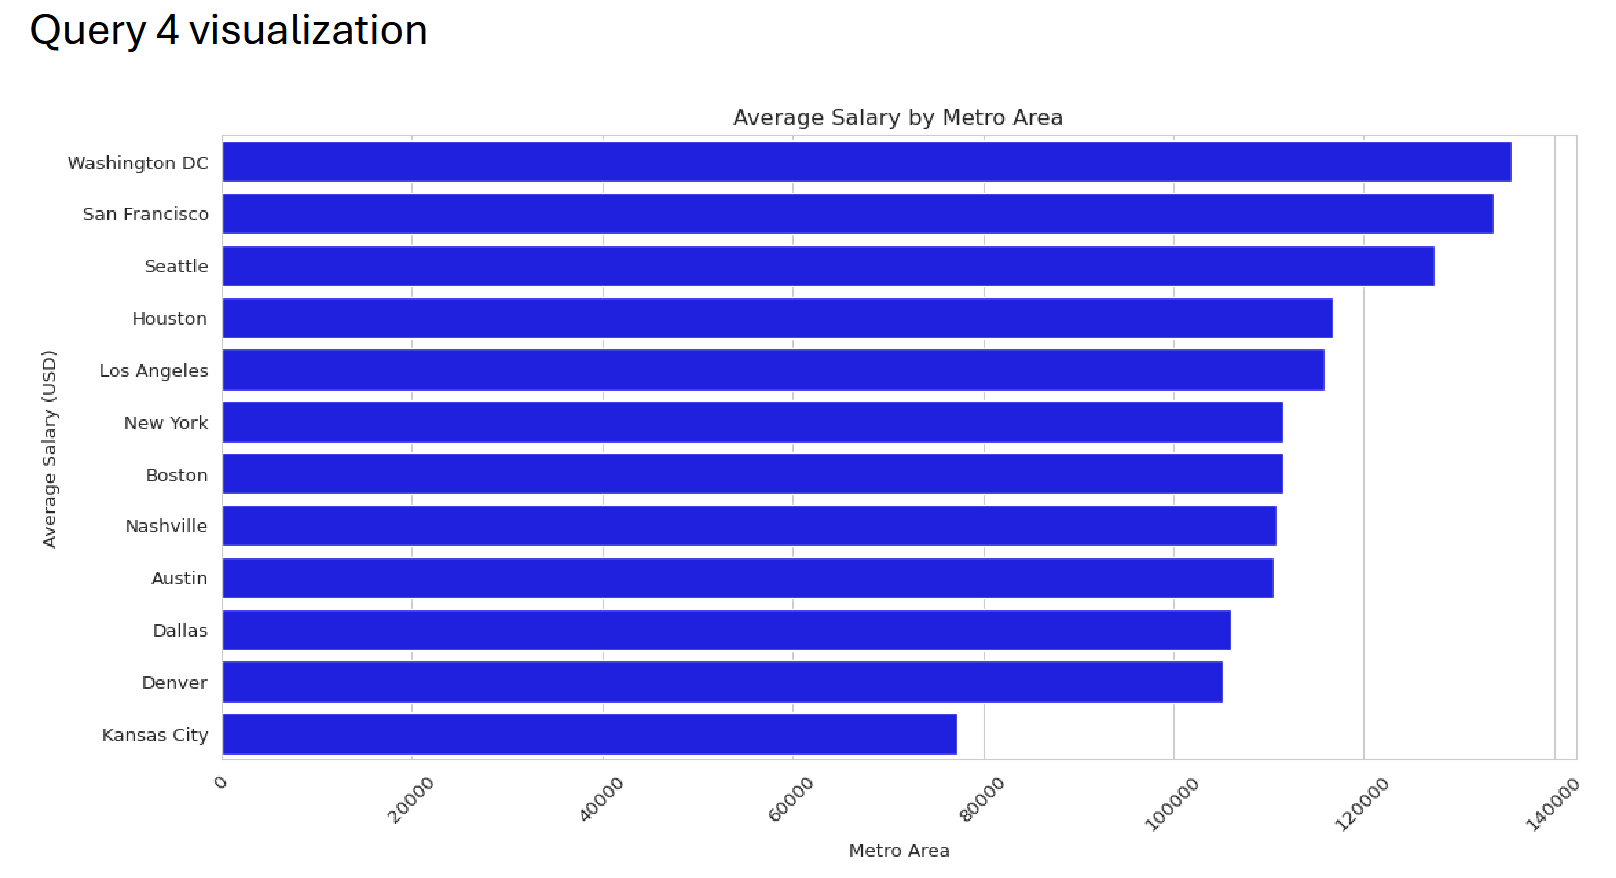
[These are some of the graphs that were created for this assignment]
Link: Assignment 2 GitHub
Assignment 3
Assignment 3
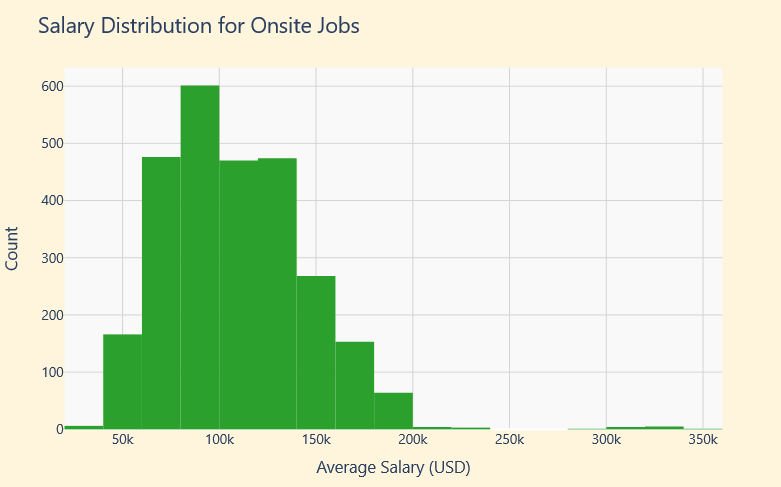
Assignment Description: This assignment focuses on the different industries and the pay differences that can be observed throughout them. This is something that was observed through LinkedIn data and could break out what types of job fields individuals may be interested in going into. Some of these graphs indicate that more specific jobs with unique skillsets have higher paying jobs but also show that those higher paying jobs may have less job postings overall. There was also the correlation of degree to pay, which is noted in the later charts and sorting through this data could indicate if pursuing a degree or more experience would be worth it for an individual in the long run.
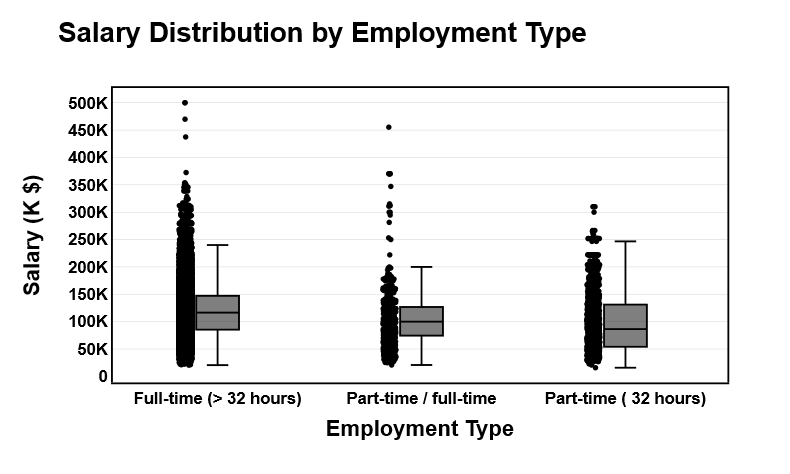
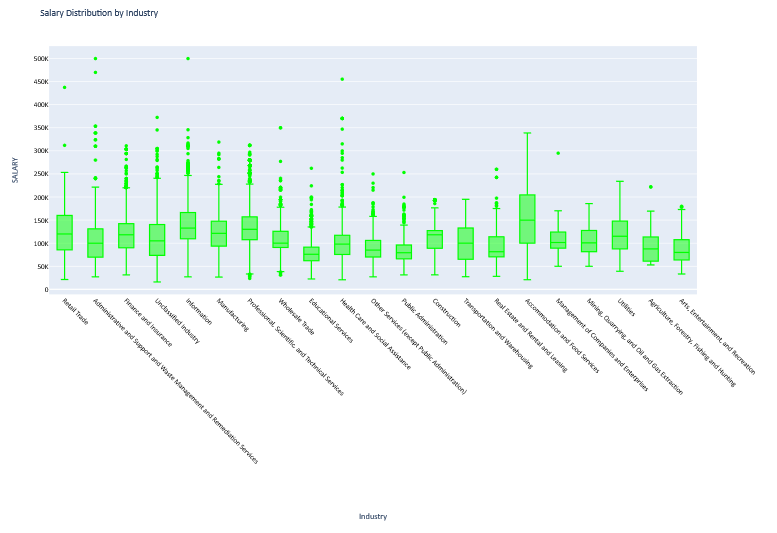
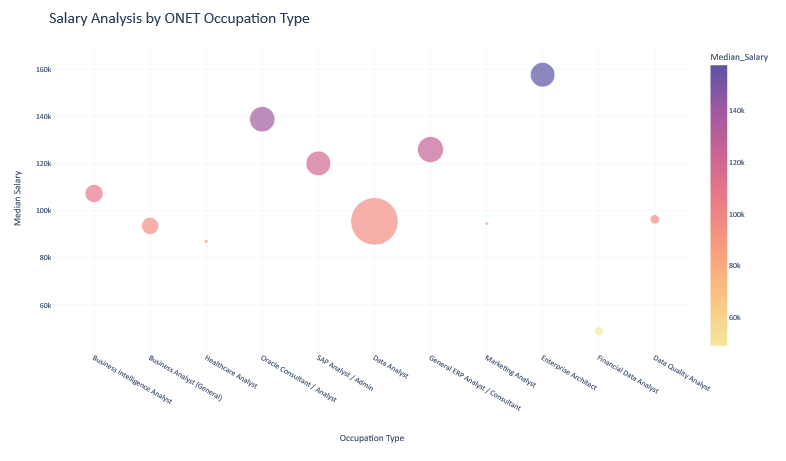
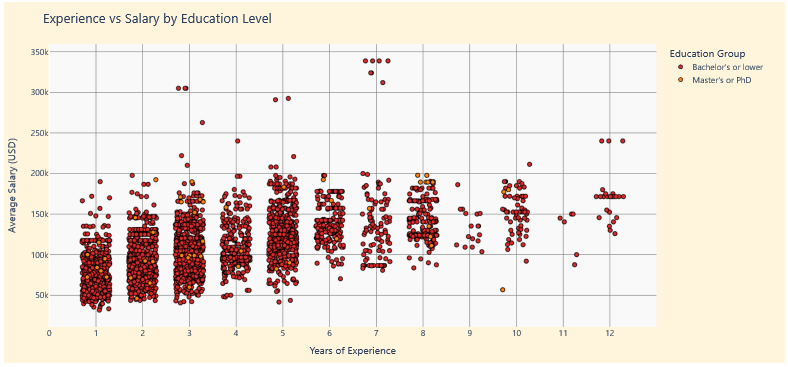
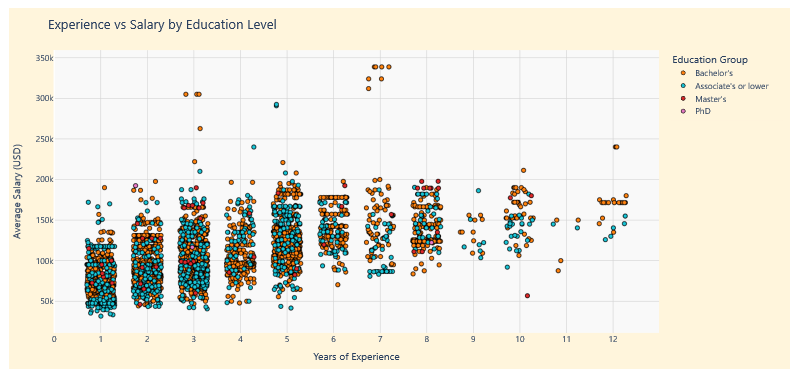
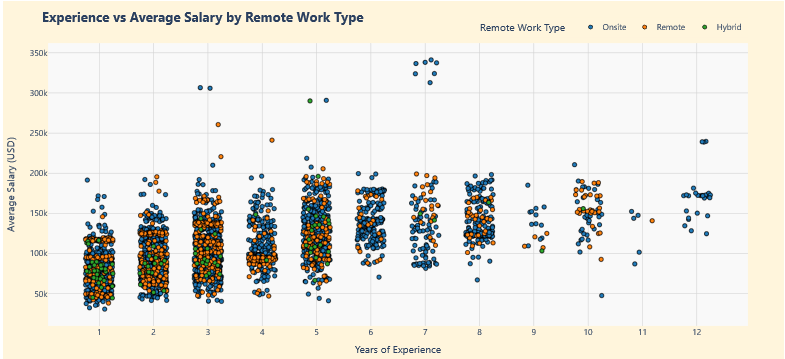
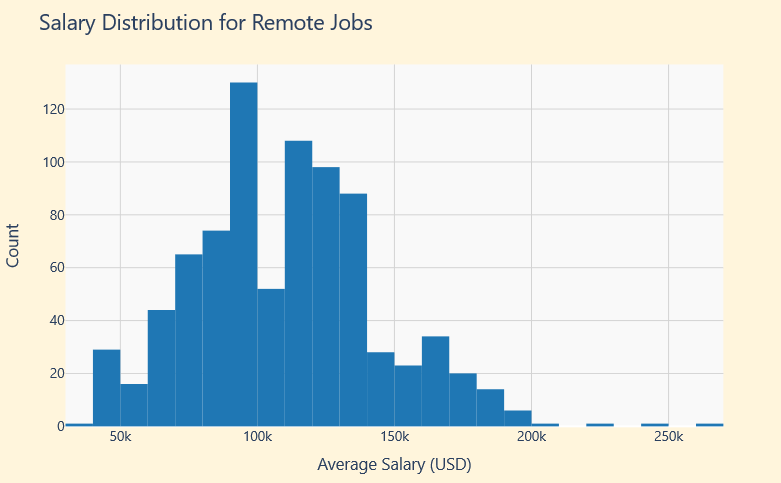
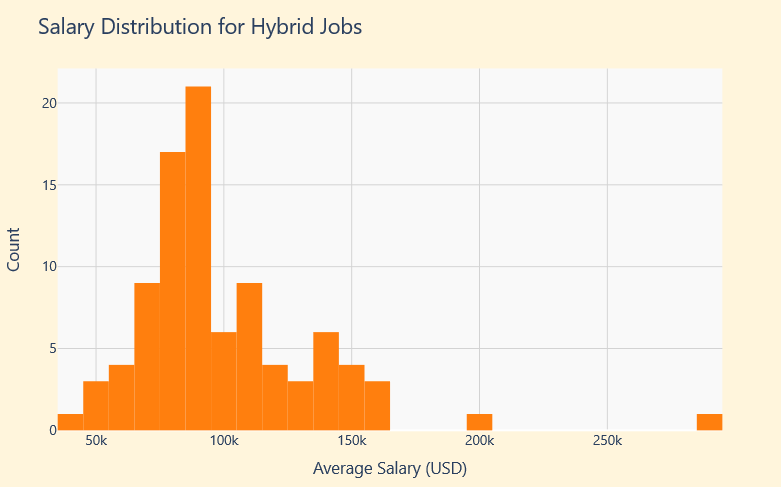
[These are some of the graphs that were created for this assignment]
Link: Assignment 3 GitHub
Assignment 4
Assignment 4
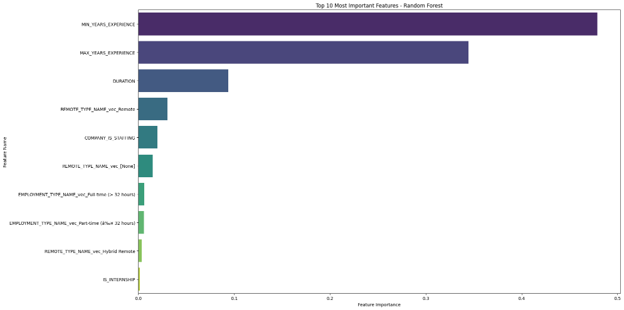
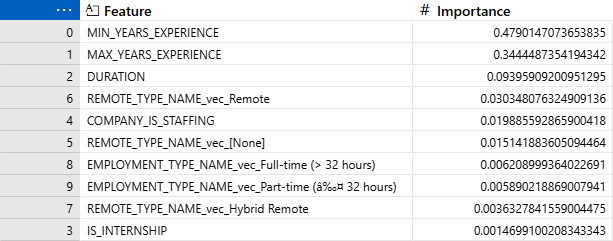
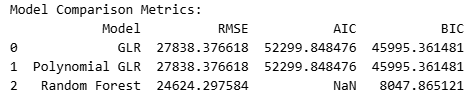
Assignment Description: This assignment focused on building and comparing multiple machine learning models—including Generalized Linear Regression, Polynomial Regression, and Random Forest—to predict salaries using job posting data. The project evaluated each model using performance metrics and visualizations, identified the most influential features affecting salary predictions, and compared model accuracy to determine the strengths and limitations of each approach.
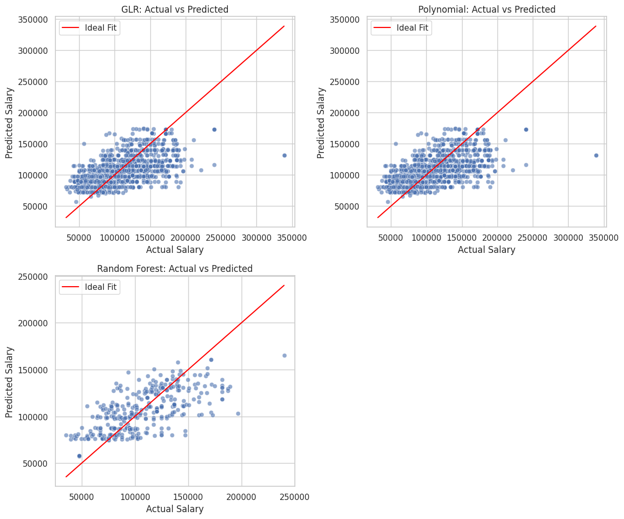
[These are some of the graphs that were created for this assignment]
Link: Assignment 4 GitHub
Data Mining for Business Analytics
Assignment 1
Assignment 1
Assignment description: This assignment focused on cleaning, exploring, and analyzing a large real-world dataset containing more than 780,000 Chicago building ordinance violations using Python and Pandas. The project involved data preprocessing, handling missing values, converting and analyzing date variables, engineering new features such as CityDelay and Season, filtering data by geographic ward, and performing descriptive statistical analysis. Multiple visualizations—including bar charts and histograms—were created to identify trends in ordinance violations, case dispositions, administrative costs, fines, and seasonal patterns. The assignment demonstrated fundamental data analytics skills including data wrangling, exploratory data analysis (EDA), feature engineering, aggregation, and visualization to transform raw municipal data into meaningful business insights.
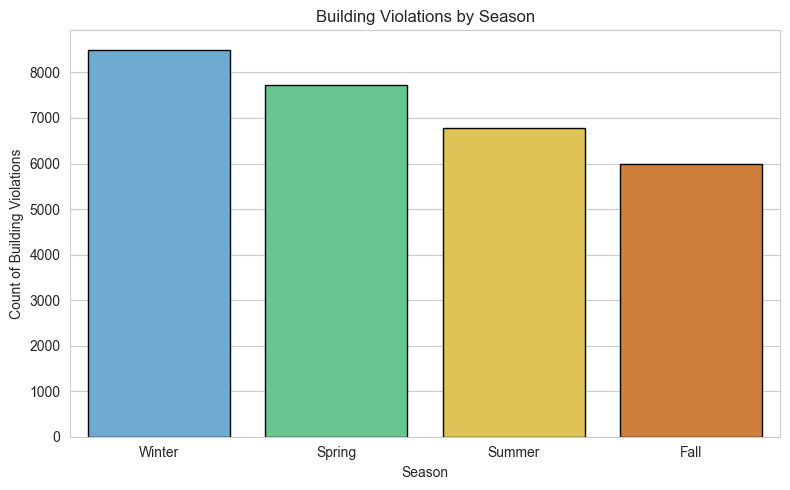
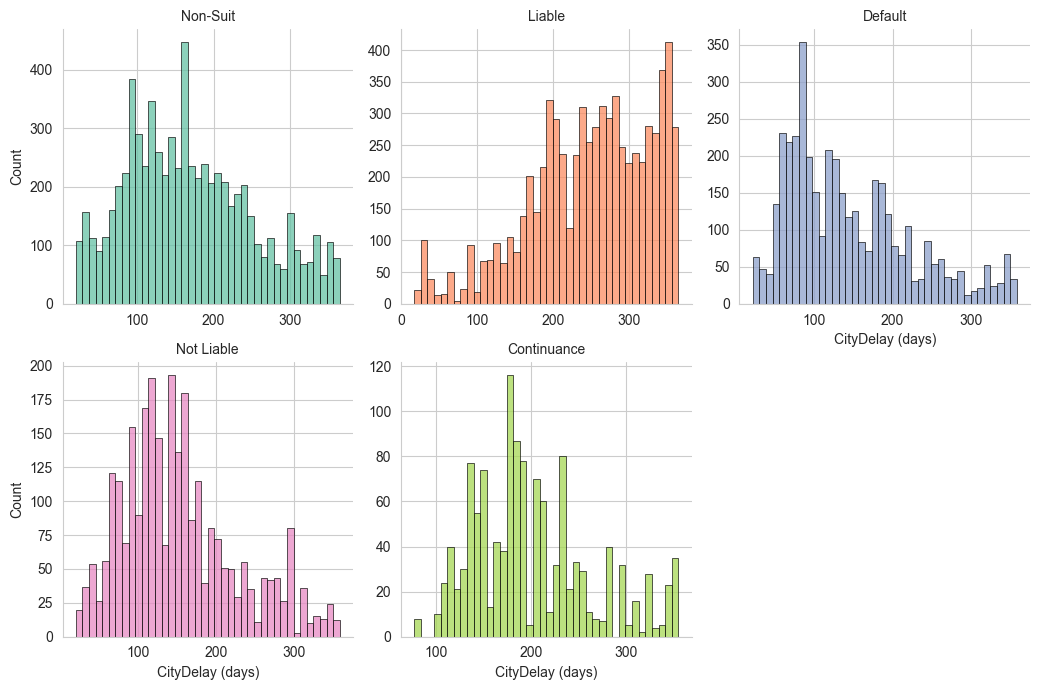
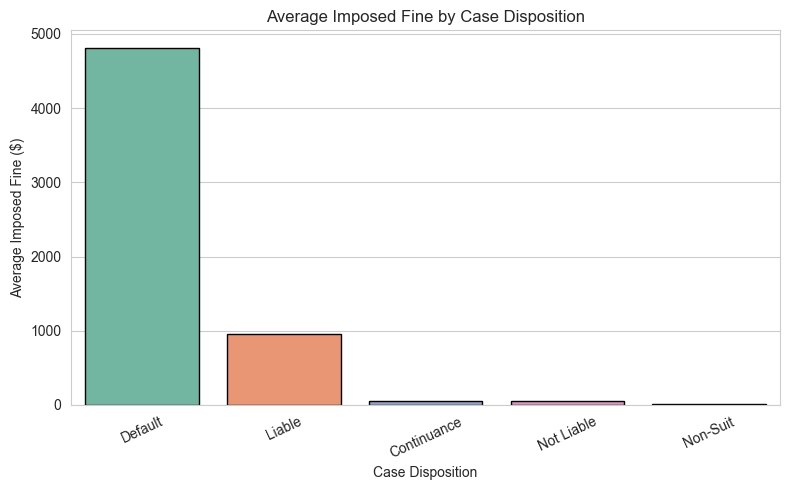
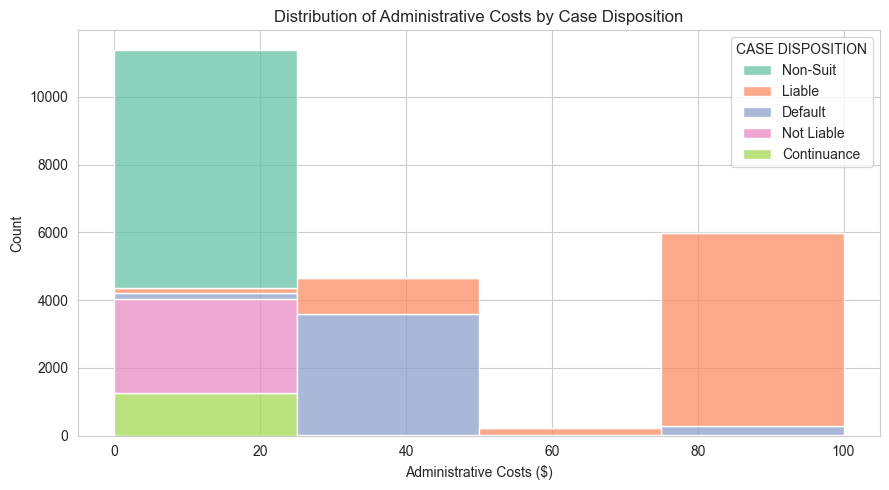
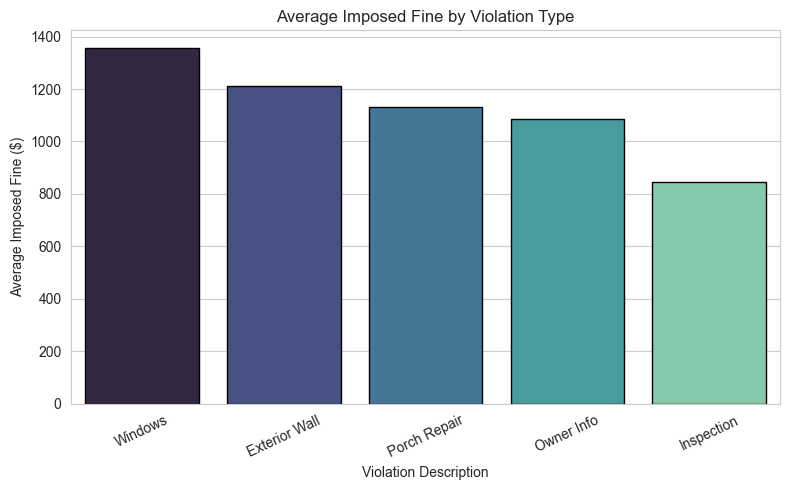
[These are some of the graphs that were created for this assignment]
Link: Assignment 1 GitHubAssignment 2
Assignment 2
Assignment description: This assignment focused on developing and evaluating multiple predictive analytics models using Python and scikit-learn. The project began with Simple Linear Regression to examine the relationship between income and the number of dependents, followed by Multiple Linear Regression to predict credit card expenditures using several demographic and financial variables. The final section implemented a k-Nearest Neighbors (k-NN) classification model to predict whether a user would like a song based on Spotify audio features. Throughout the assignment, data was split into training and validation sets, model performance was evaluated using statistical metrics and residual analysis, and visualizations were created to interpret relationships, assess prediction accuracy, and identify the optimal model parameters. The assignment demonstrated practical applications of regression analysis, supervised machine learning, model validation, and predictive analytics using real-world datasets.
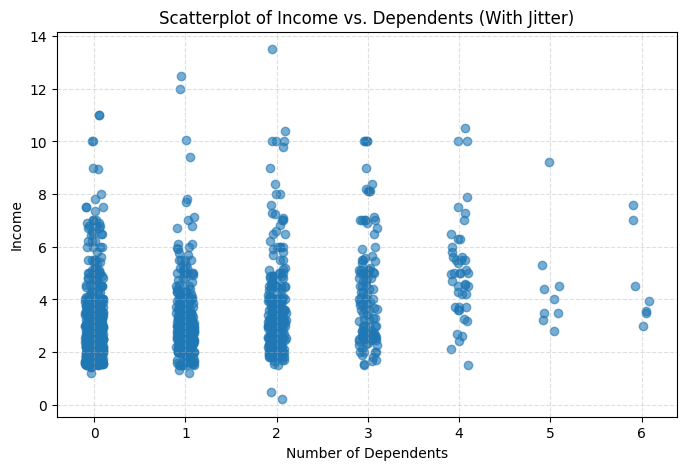
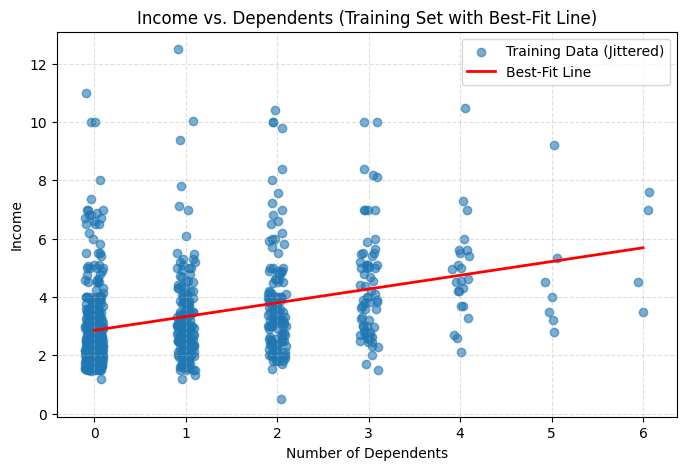
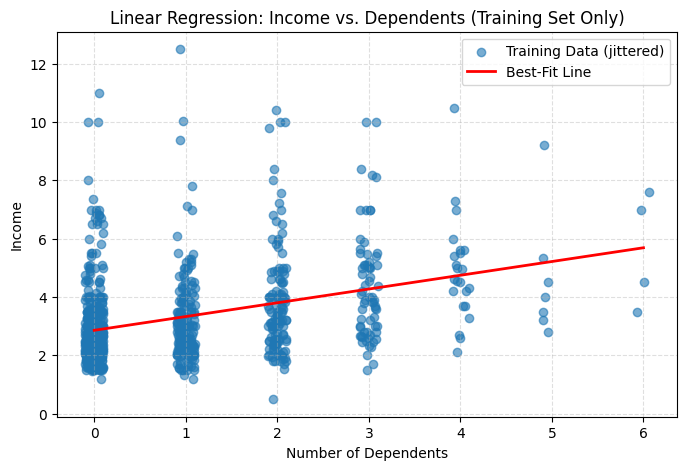
[These are some of the graphs that were created for this assignment]
Link: Assignment 2 GitHub
Assignment 3
Assignment 3
Assignment description: This assignment focused on building, evaluating, and comparing classification-based machine learning models to predict whether a college would have a high or low student yield rate. The project included data preprocessing, feature engineering by creating a yield variable from enrollment and acceptance data, converting the target into categorical classes, and partitioning the dataset into training and validation sets. A Decision Tree classifier was developed and interpreted by analyzing feature importance, tree structure, and root node splits, followed by the construction of a Random Forest classifier to improve predictive performance. Both models were evaluated using confusion matrices, classification reports, and accuracy metrics, allowing for a comparison of model performance, overfitting, and generalization. The assignment demonstrated practical applications of supervised classification, feature engineering, model evaluation, and model selection using Python and scikit-learn.
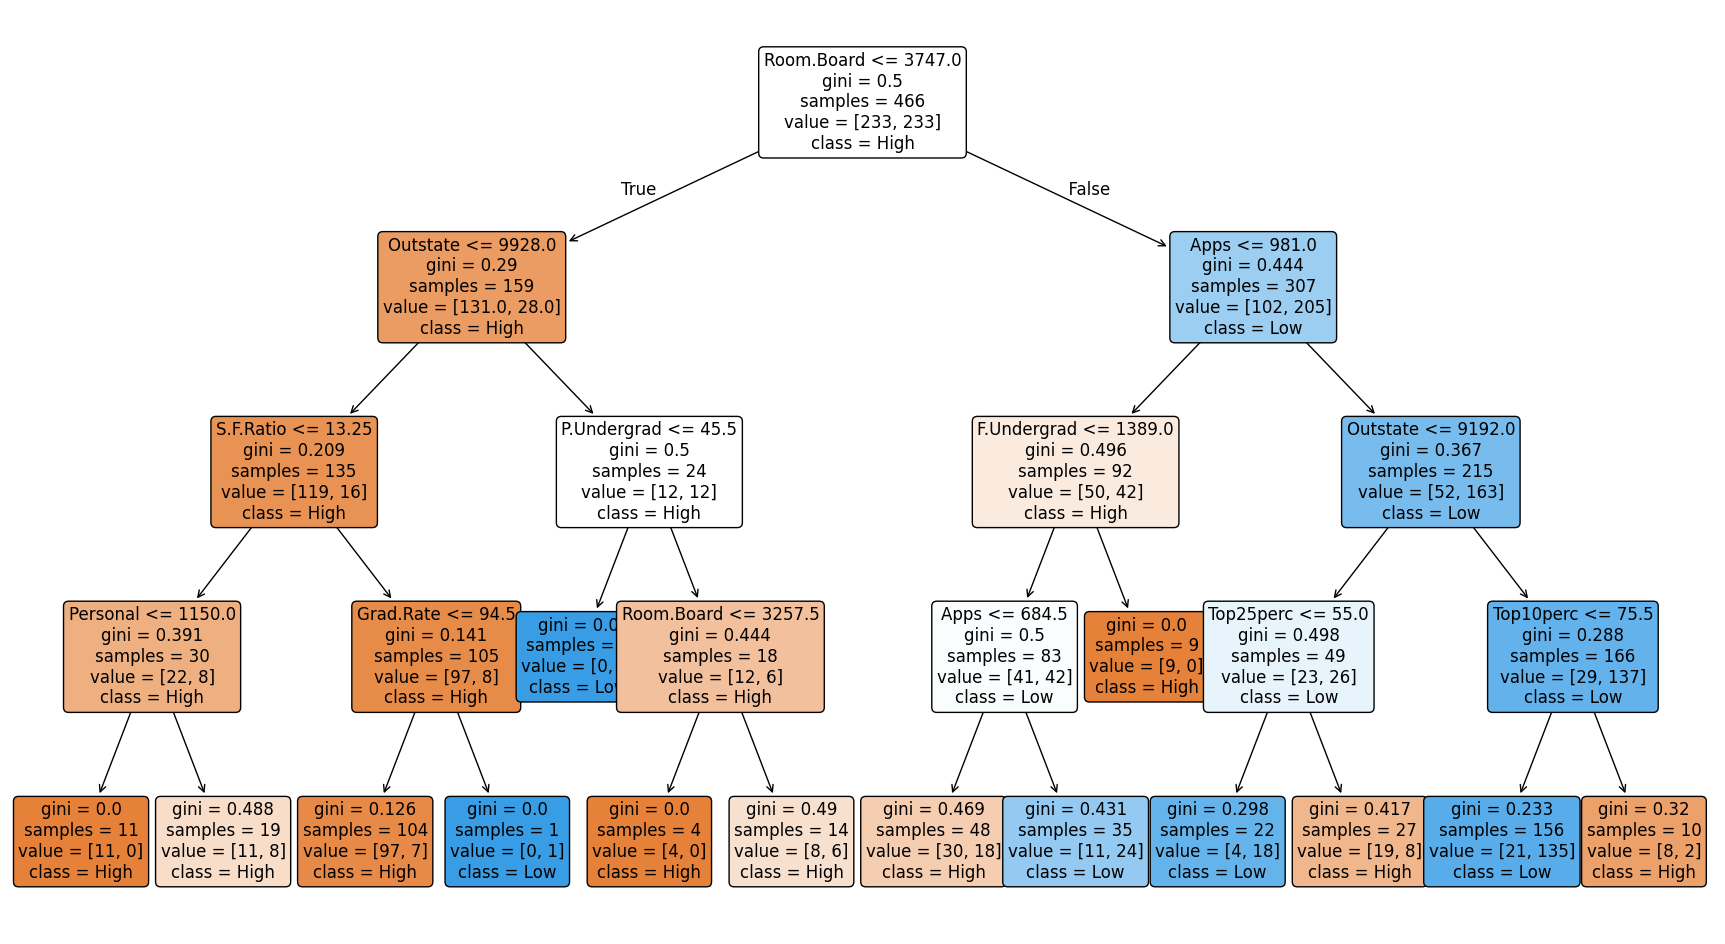
[These are some of the graphs that were created for this assignment]
Link: Assignment 3 GitHub
Group Project
Group Project
Assignment description: This group project analyzed over 2,000 Airbnb listings in Zurich, Switzerland to uncover pricing trends, neighborhood characteristics, and factors influencing listing performance using Python and machine learning. The project included extensive data cleaning, exploratory data analysis (EDA), feature engineering, and interactive geographic mapping to examine relationships between location, amenities, pricing, and guest reviews. Multiple visualizations—including box plots, correlation heatmaps, word clouds, scatter plots, histograms, and interactive Folium maps—were created to identify key market trends. Predictive analytics techniques such as Multiple Linear Regression, k-Nearest Neighbors (k-NN), Decision Trees, Random Forests, K-Means Clustering, Principal Component Analysis (PCA), and Natural Language Processing (TF-IDF) were implemented to model listing prices, classify amenities, segment properties, and analyze neighborhood descriptions. The project demonstrated end-to-end data science skills including data preprocessing, statistical analysis, machine learning, geospatial visualization, text analytics, model evaluation, and the communication of actionable business insights for the short-term rental market.
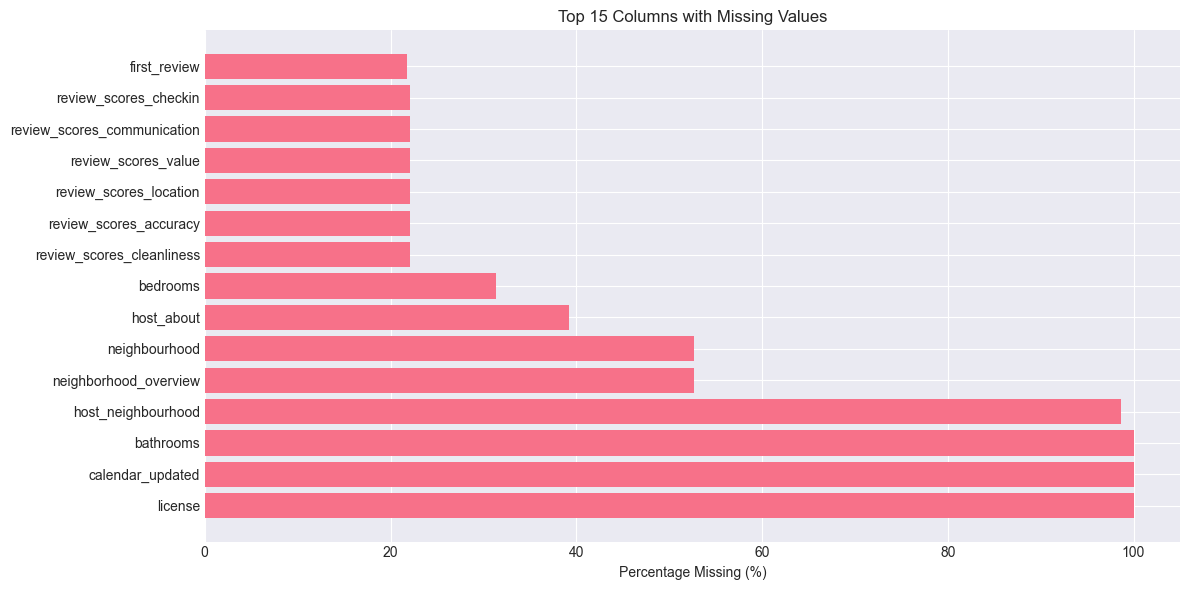
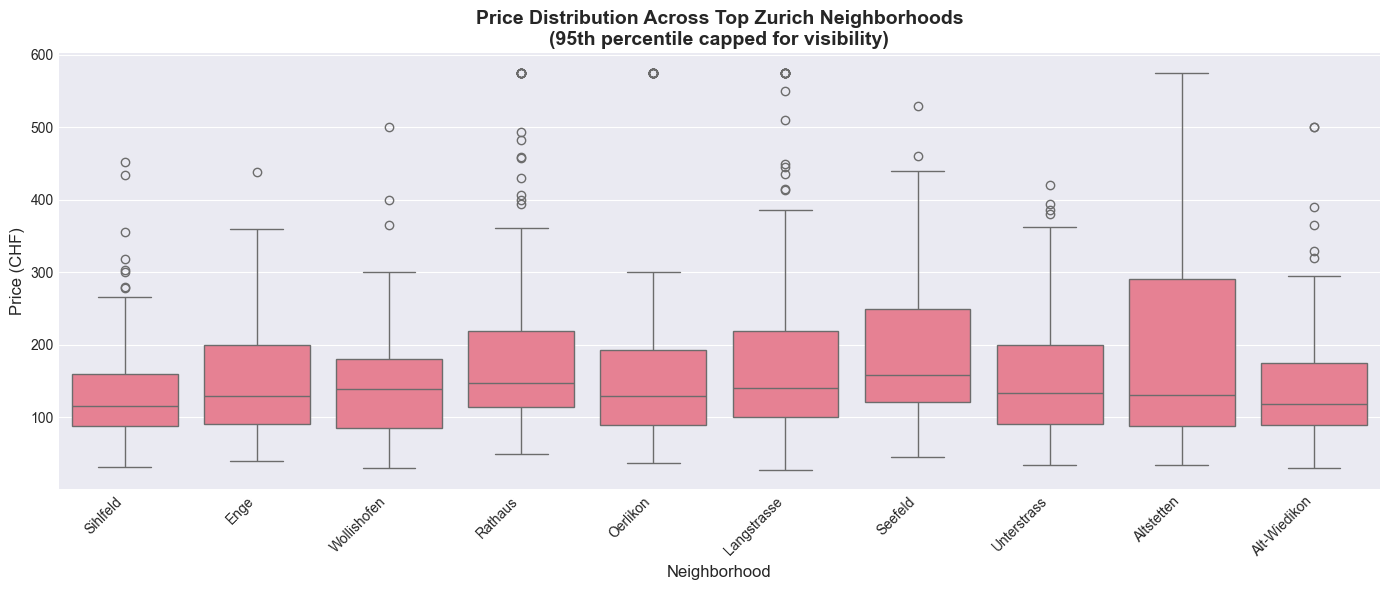
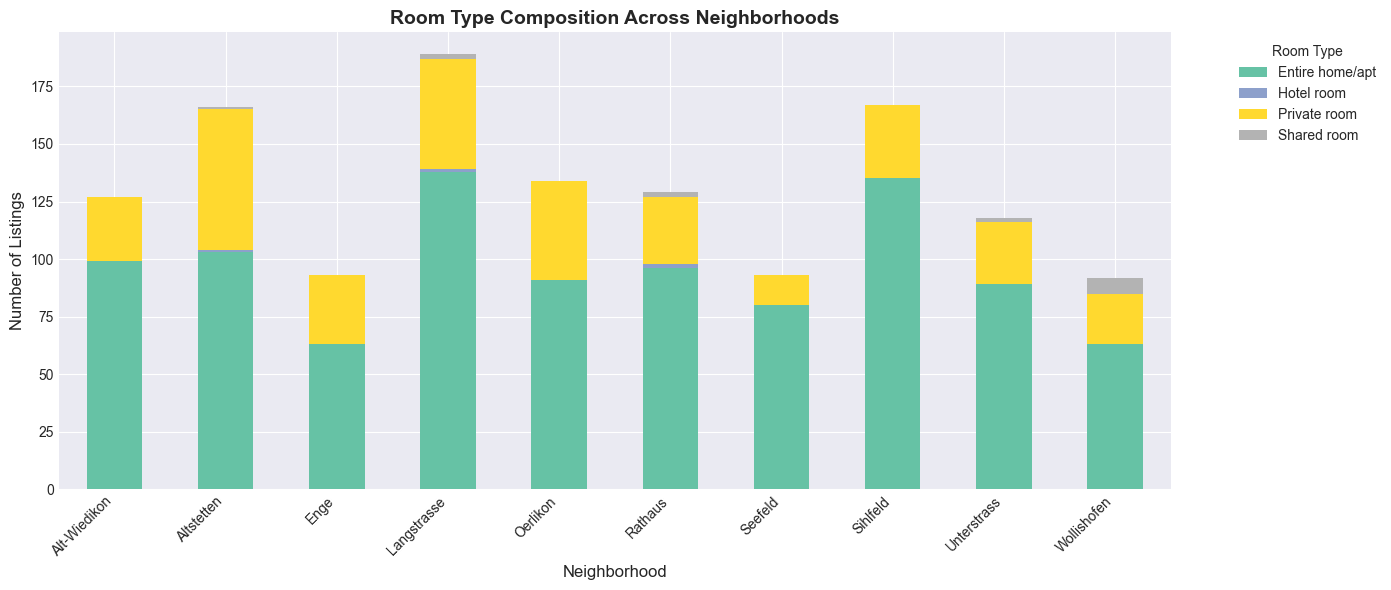
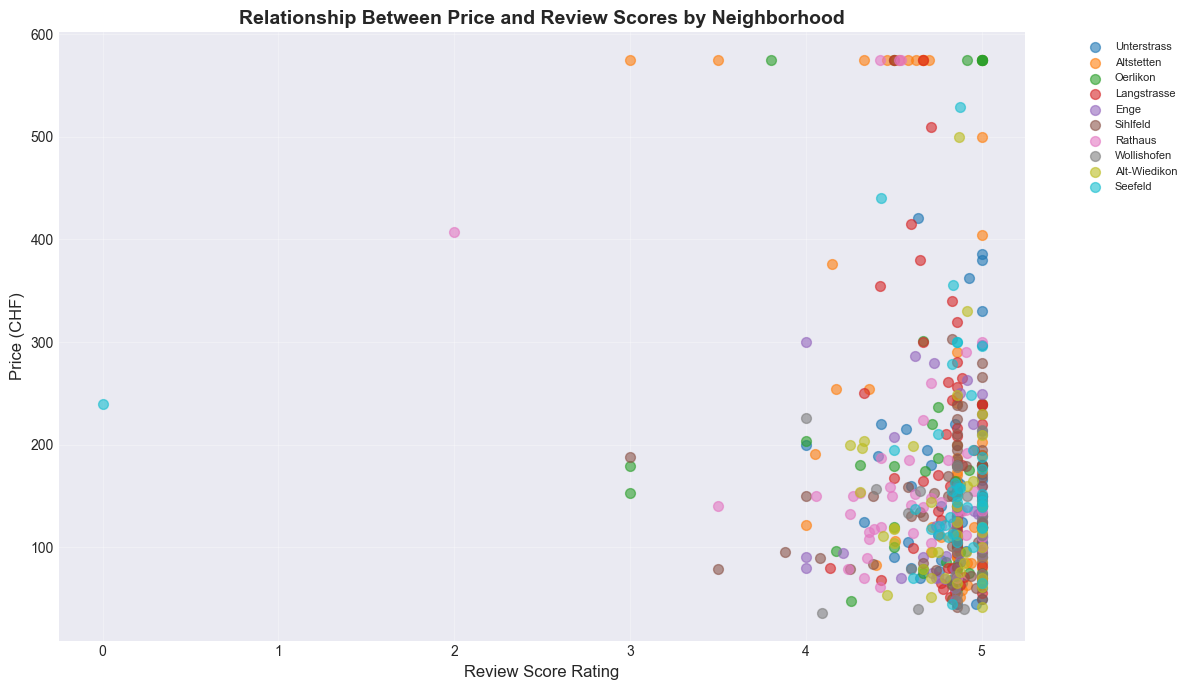
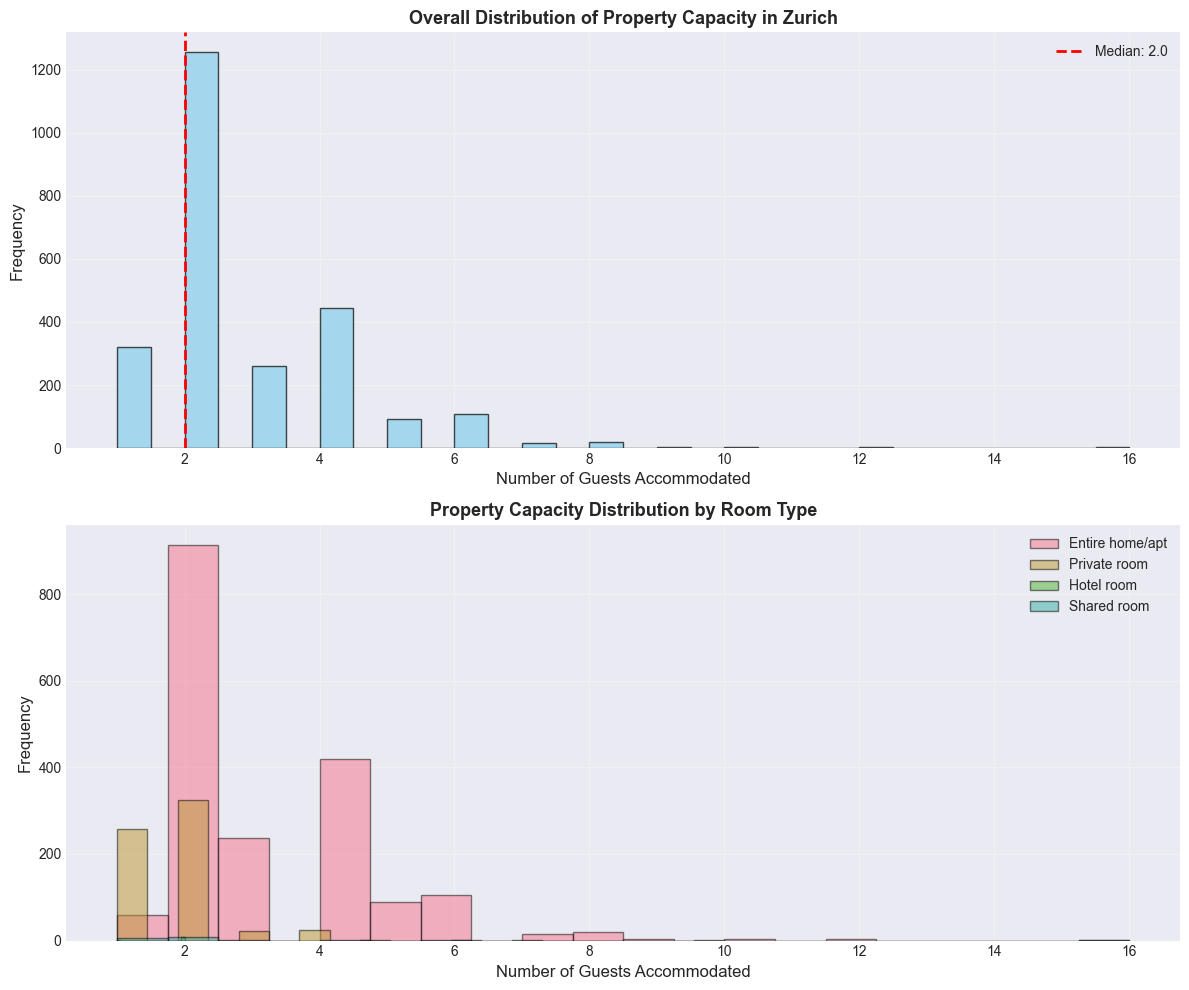
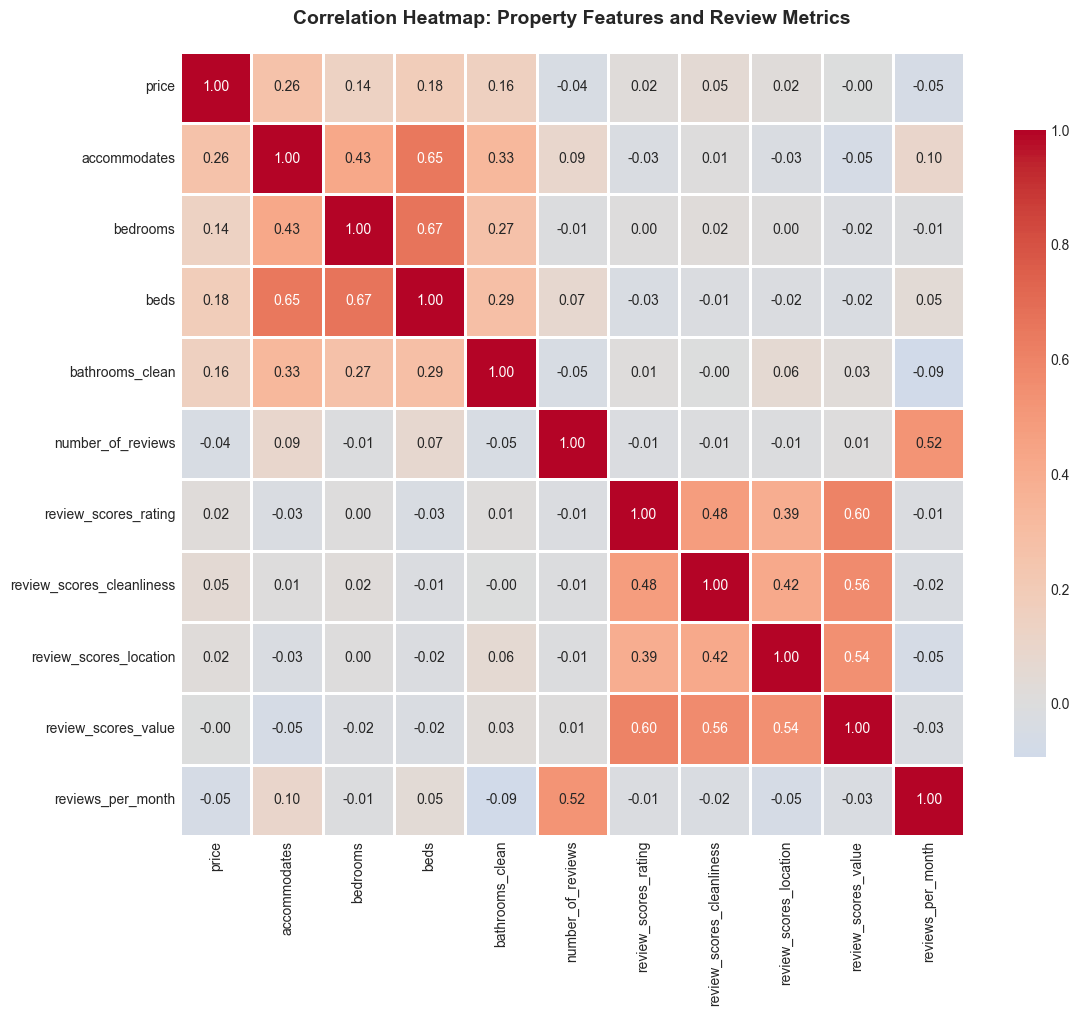
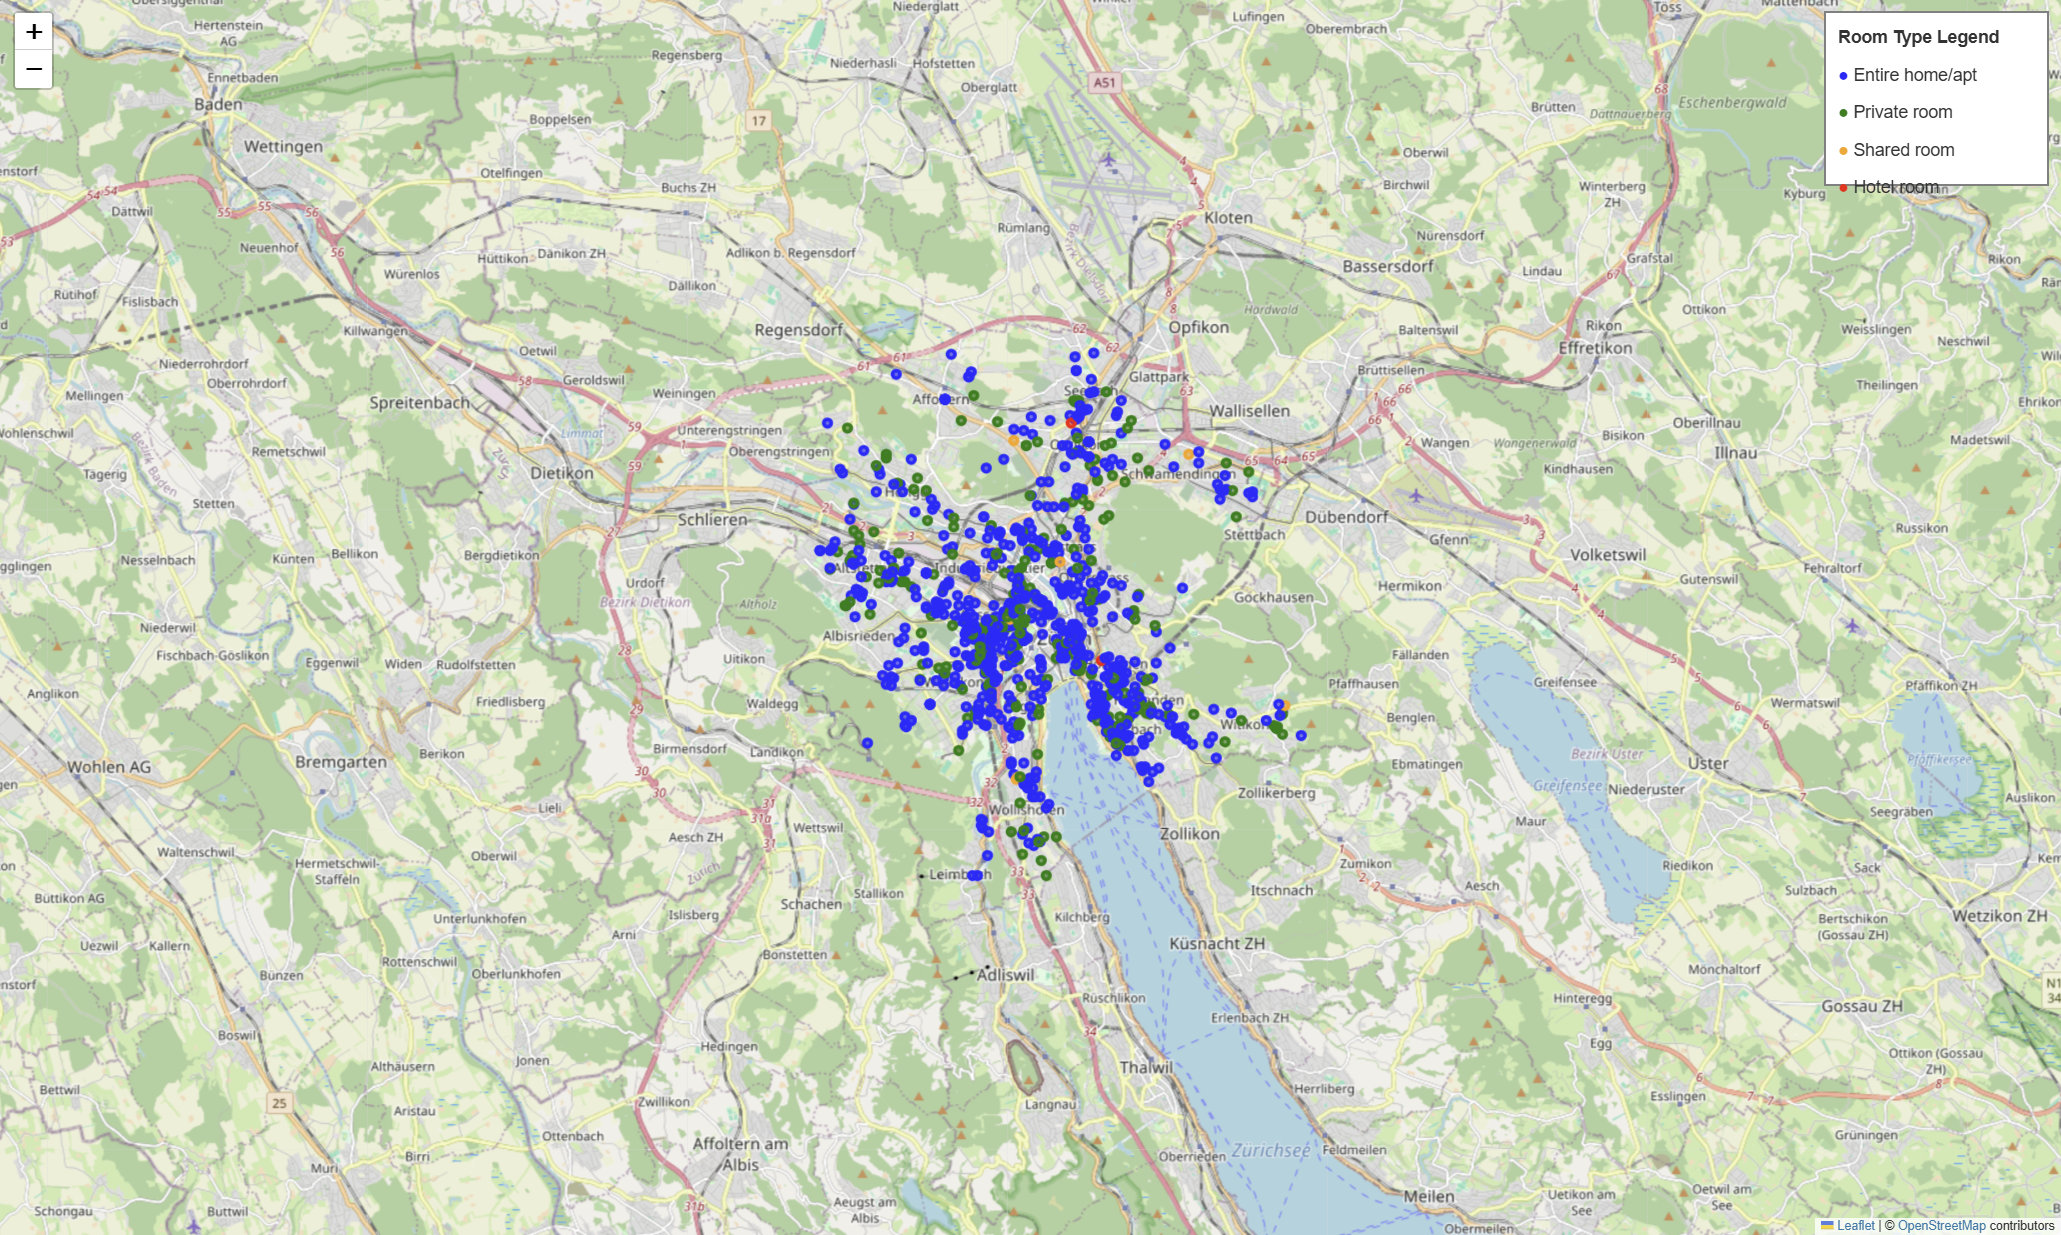
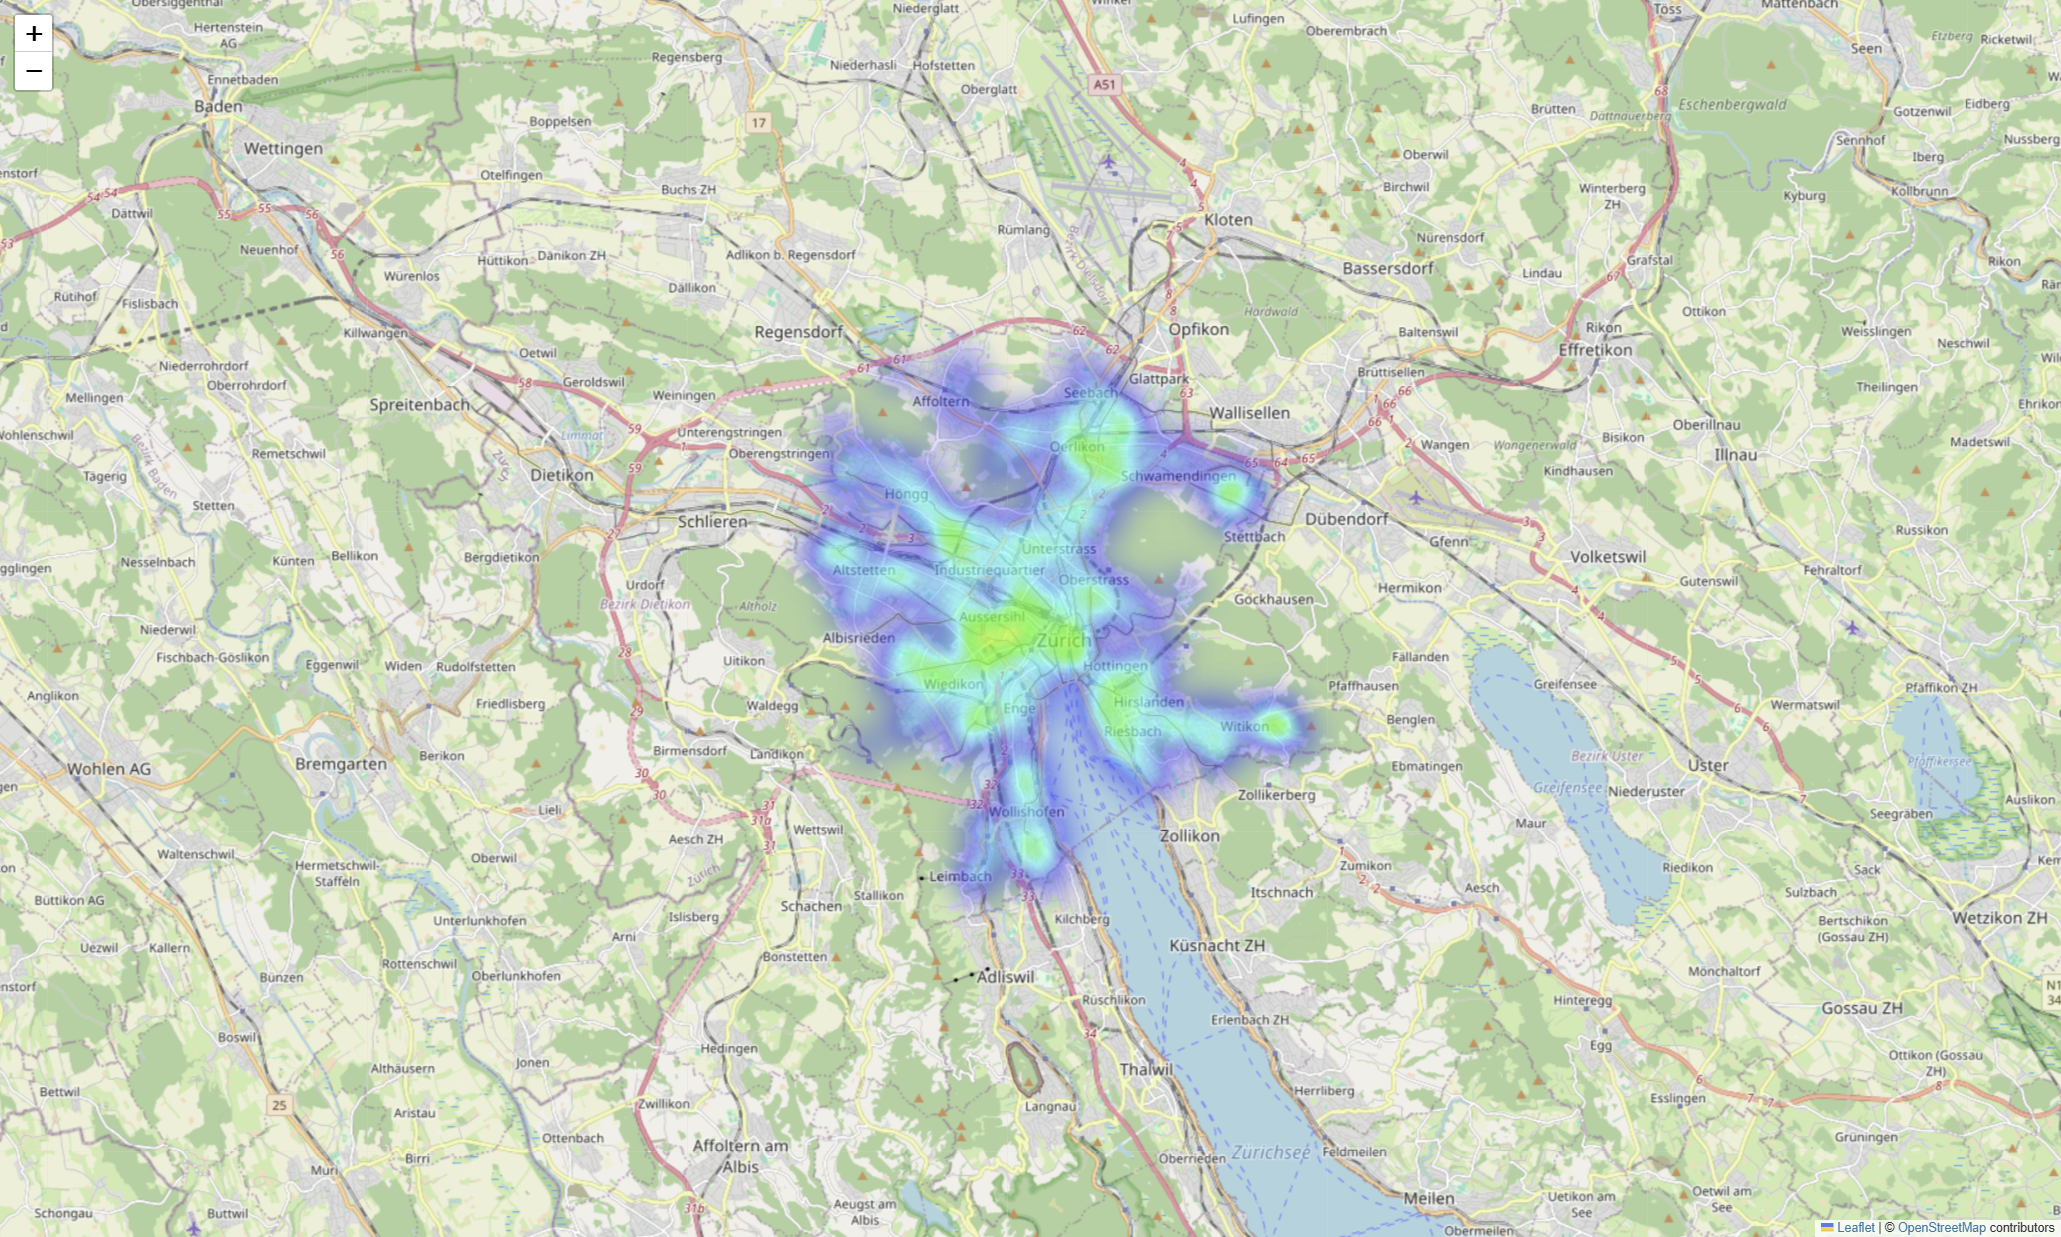
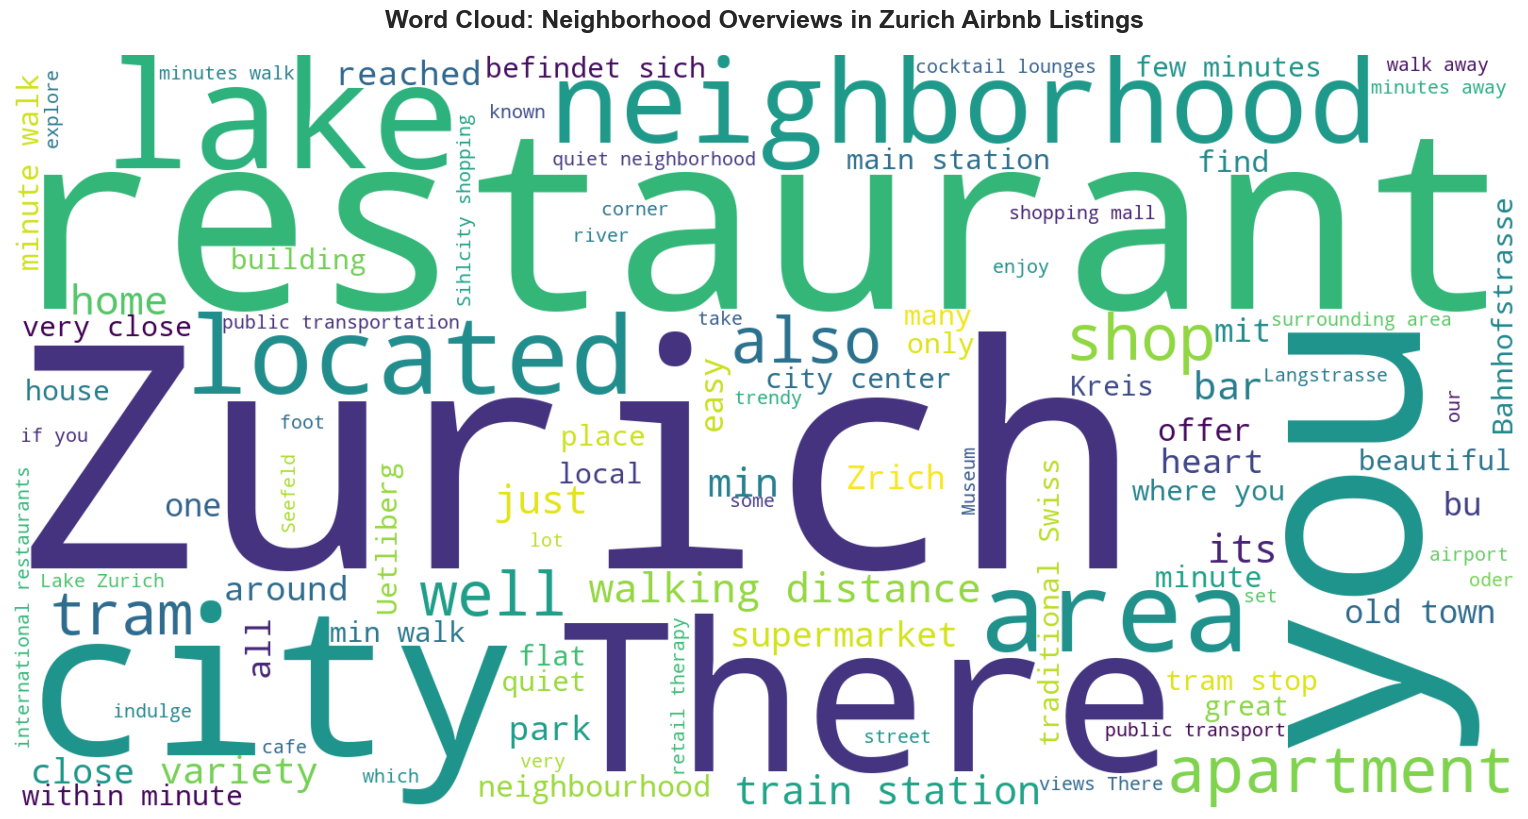
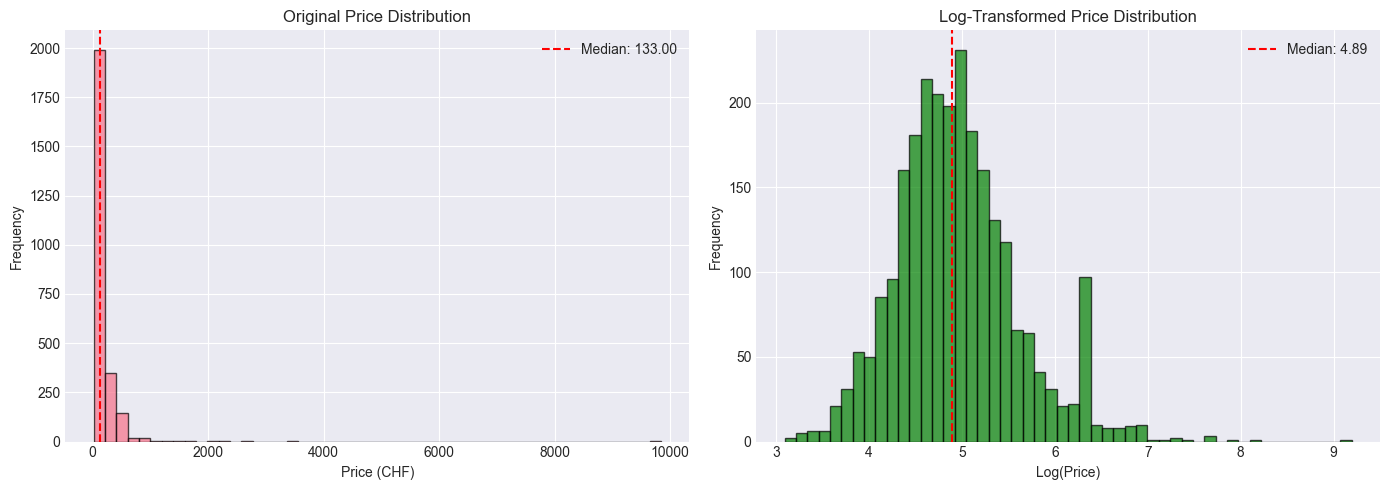
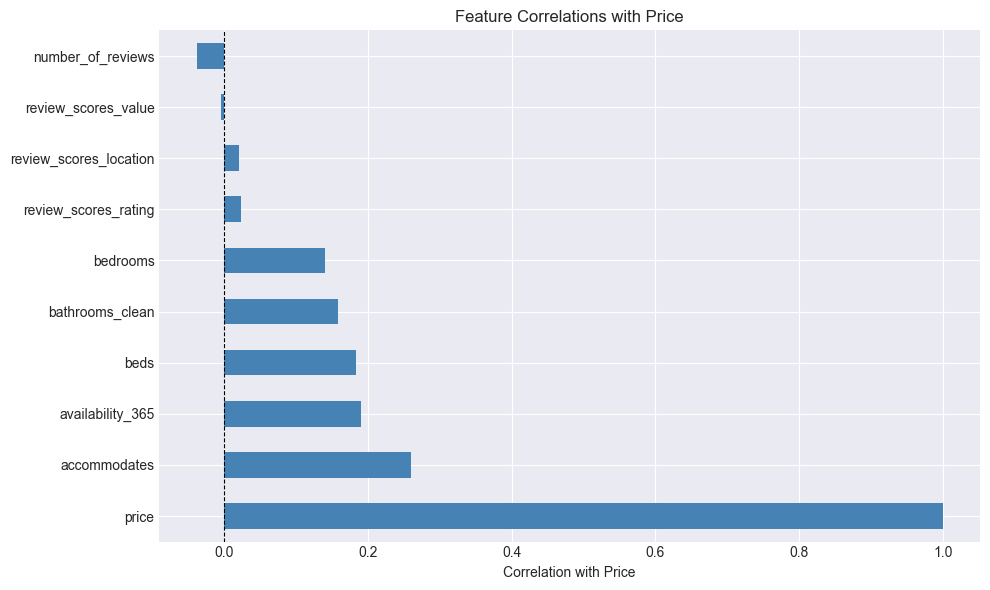
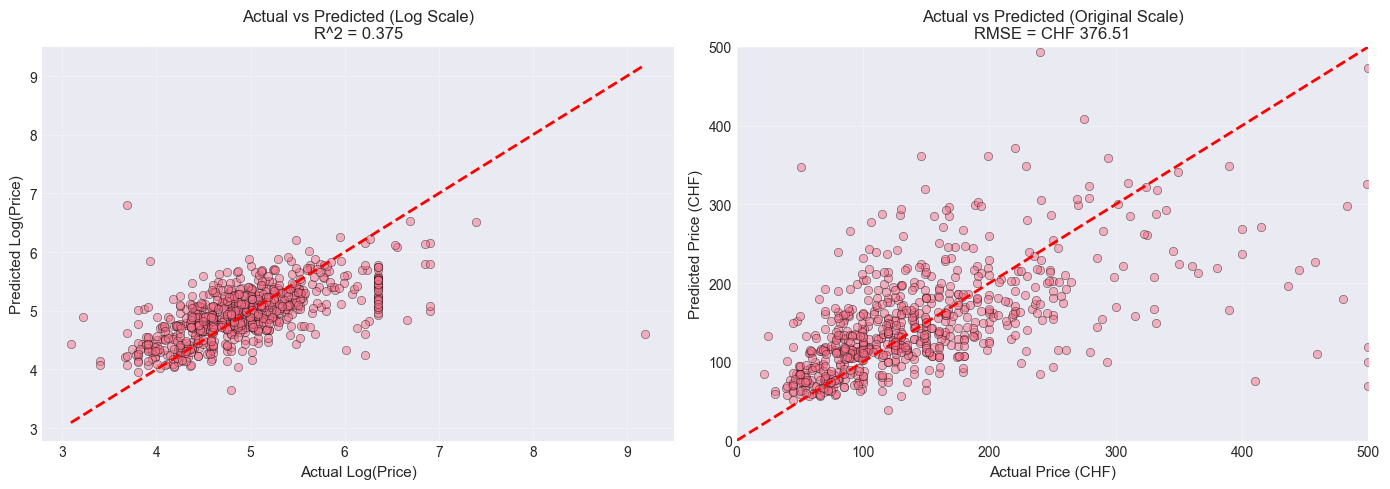
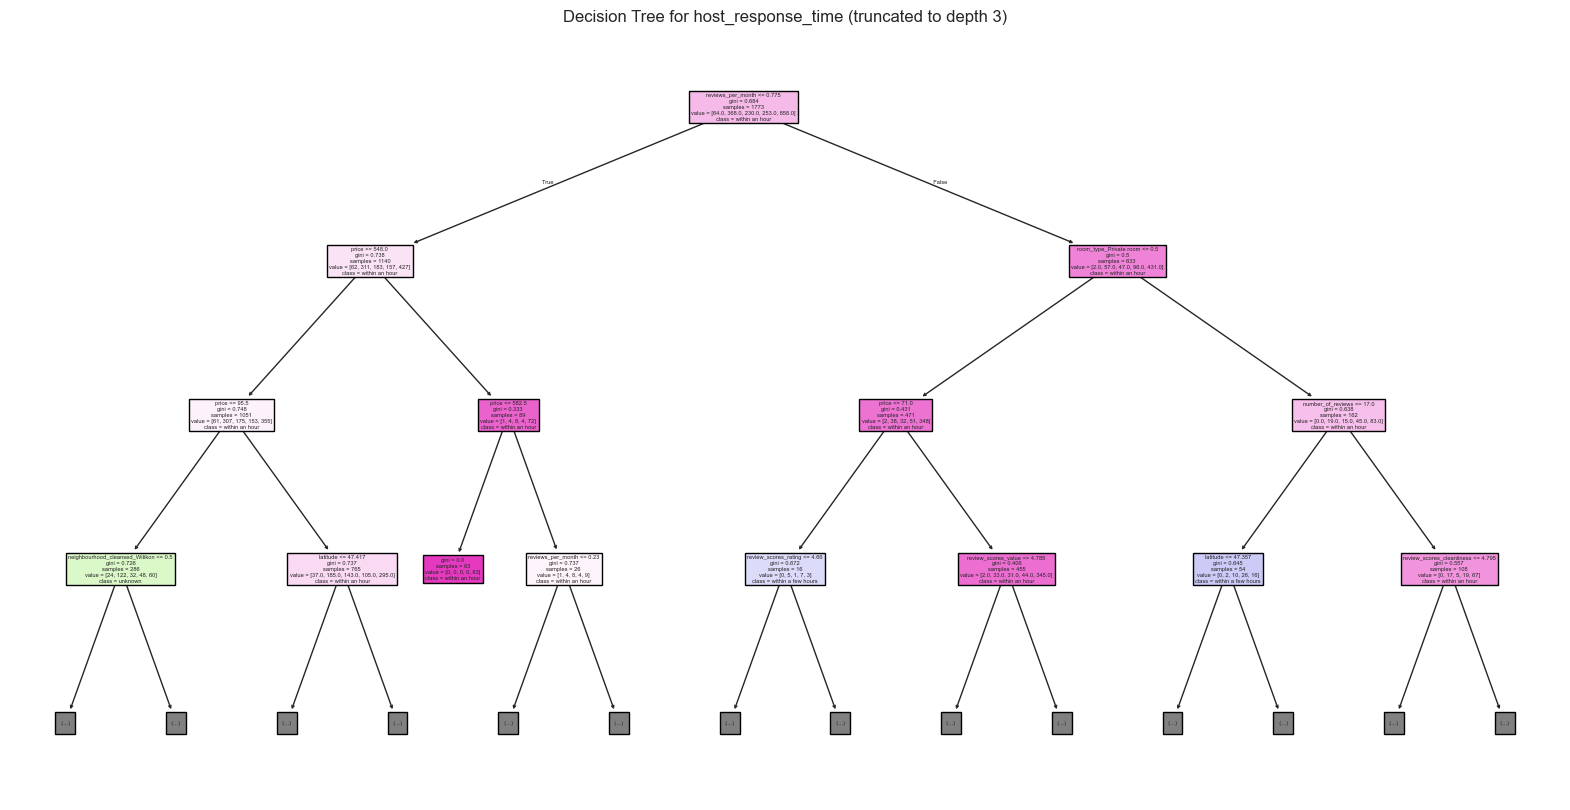
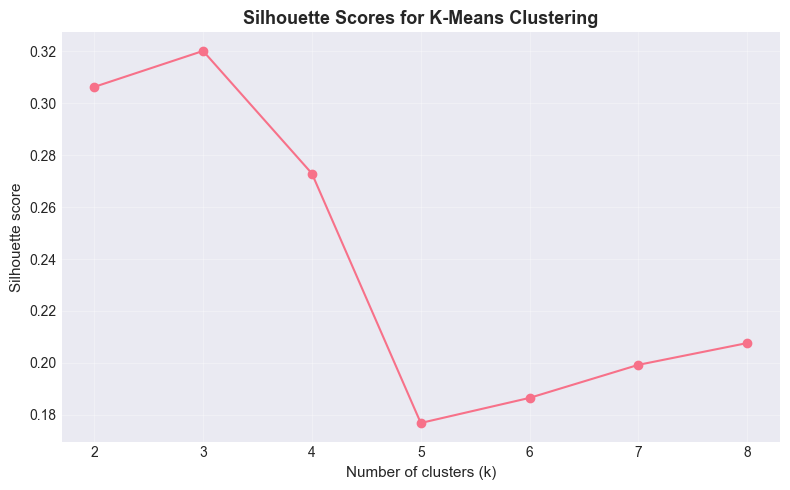
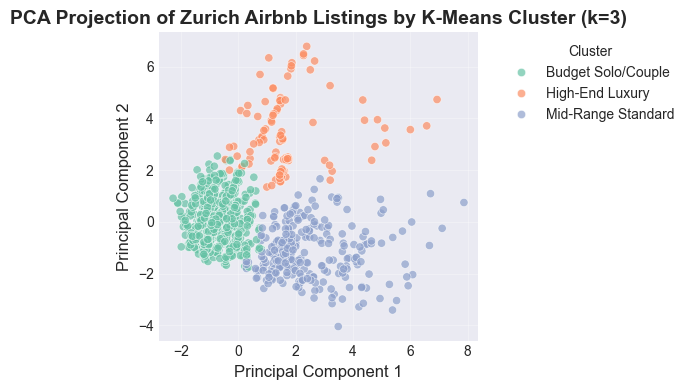
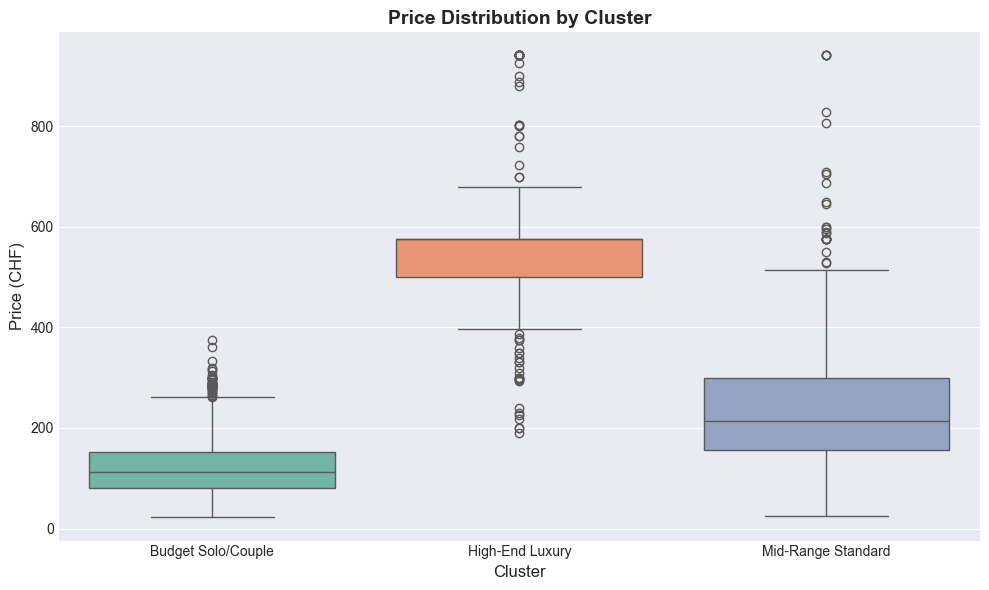
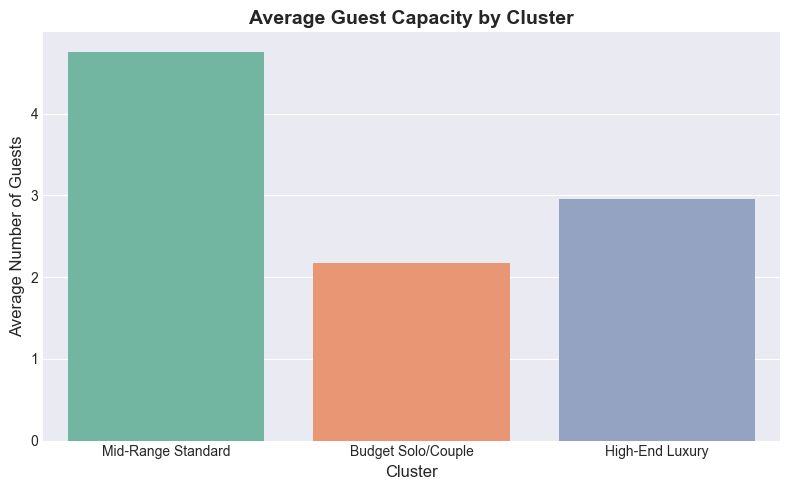
[These are some of the graphs that were created for this assignment]
Link: Group Project GitHub
Enterprise Risk Analysis
Assignment 1
Assignment 1
Assignment description: This assignment introduced the fundamentals of Monte Carlo simulation by modeling uncertainty across three real-world business scenarios using Python. The project simulated call center demand, cell phone battery refund costs, and coffee cart profitability, each using 100,000 simulation trials to estimate expected outcomes and quantify risk. Probability distributions were used to model uncertain variables, while summary statistics and visualizations—including histograms and distribution plots—were generated to analyze the results. The assignment demonstrated the practical application of simulation modeling, probability distributions, risk analysis, and data visualization to support decision-making under uncertainty.
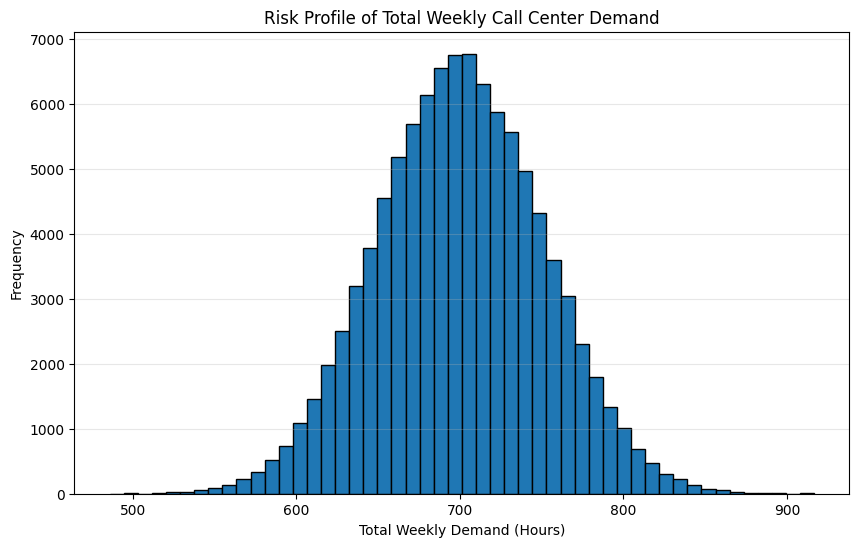
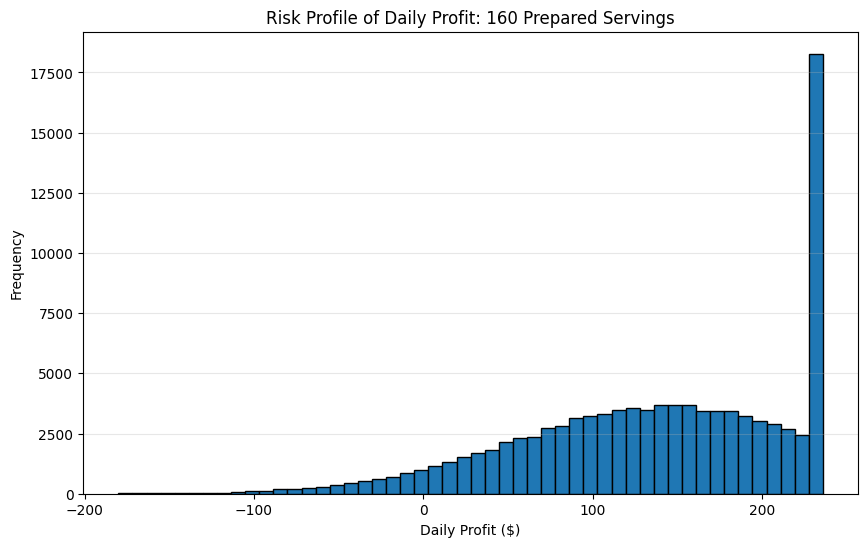
[These are some of the graphs that were created for this assignment]
Link: Assignment 1 GitHubAssignment 2
Assignment 2
Assignment description: This assignment focused on applying Monte Carlo simulation to demonstrate fundamental probability concepts and evaluate financial risk under uncertainty. The project validated the Central Limit Theorem by simulating the sum of uniformly distributed random variables, modeled order statistics using the Beta distribution, and demonstrated the relationship between the Exponential and Poisson distributions through customer purchase simulations. The final component developed a comprehensive life insurance valuation model that simulated mortality using a Weibull distribution, incorporated policy lapse probabilities and discounted cash flows, and estimated the policy’s Net Present Value (NPV) along with confidence intervals and risk metrics. Throughout the assignment, statistical distributions were compared against Monte Carlo results using histograms, probability density functions, and summary statistics, demonstrating the use of simulation modeling, probability theory, financial analysis, and data visualization to support decision-making under uncertainty.
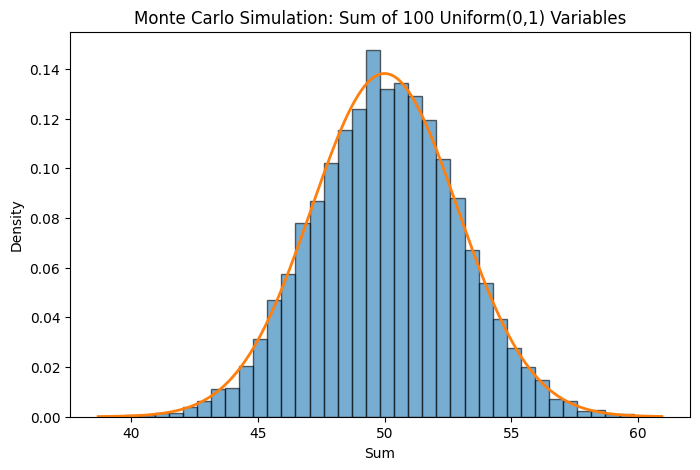
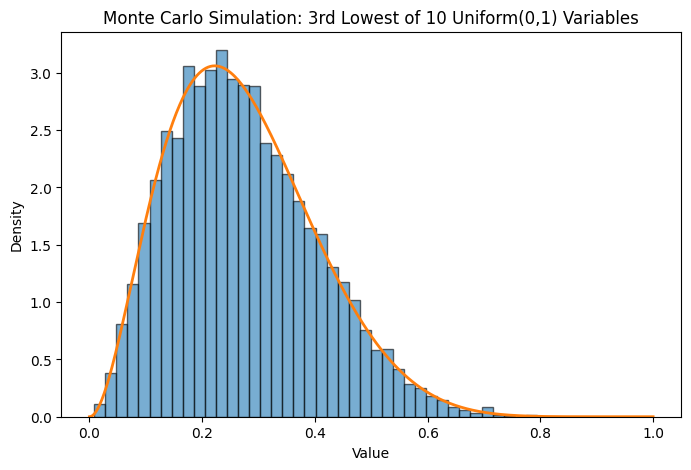
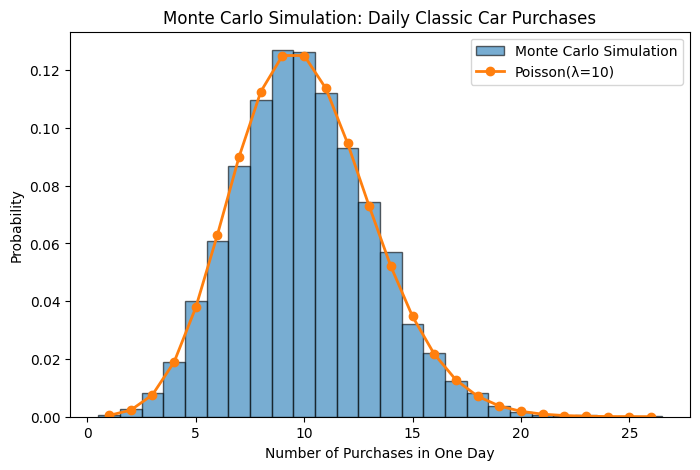
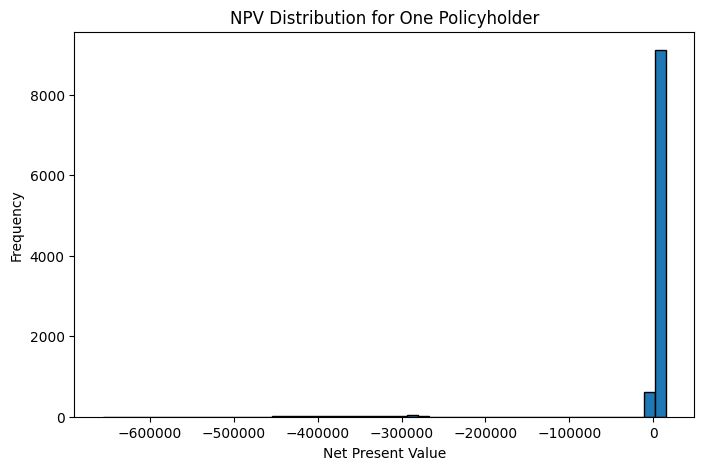
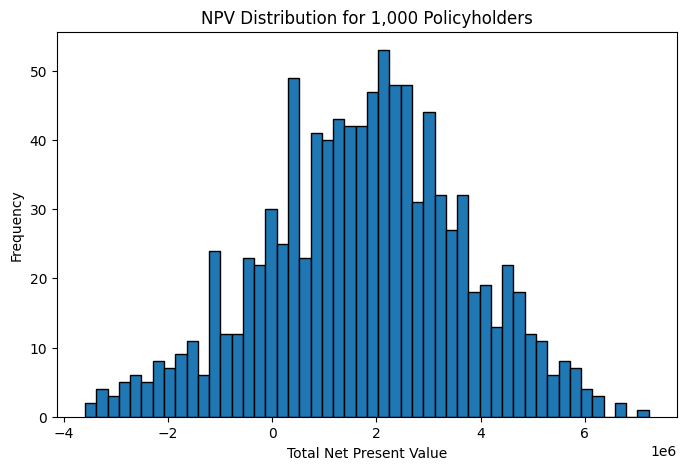
[These are some of the graphs that were created for this assignment]
Link: Assignment 2 GitHubAssignment 3
Assignment 3
Assignment description: This assignment focused on applying Monte Carlo simulation, probability distributions, and correlation modeling to solve two business decision-making problems under uncertainty. The first case developed a simulation model for GWS Electric Boats, evaluating production strategies by modeling uncertain demand, manufacturing costs, and profitability across thousands of simulated scenarios to identify the optimal production level. The second case analyzed historical restaurant reservation data by fitting statistical distributions to party size and customer spending, measuring Pearson and Spearman correlations, and implementing a Gaussian copula to preserve dependency between variables during simulation. The project compared revenue forecasts with and without correlation, demonstrating the impact of dependent variables on business outcomes. Throughout the assignment, statistical model fitting, goodness-of-fit testing, Monte Carlo simulation, and data visualization were used to quantify risk, evaluate uncertainty, and support data-driven business decisions.
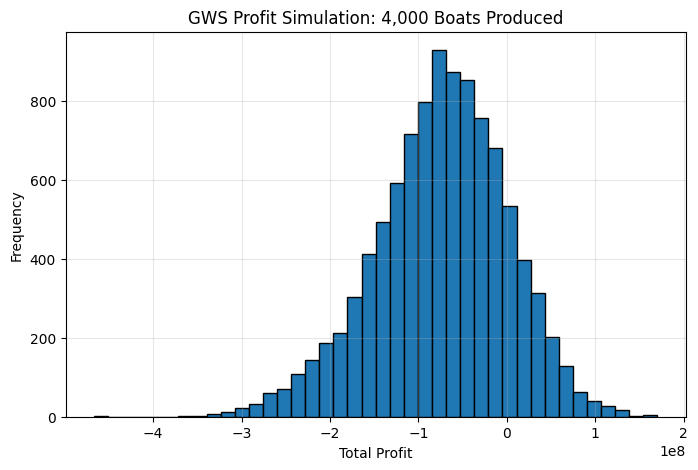
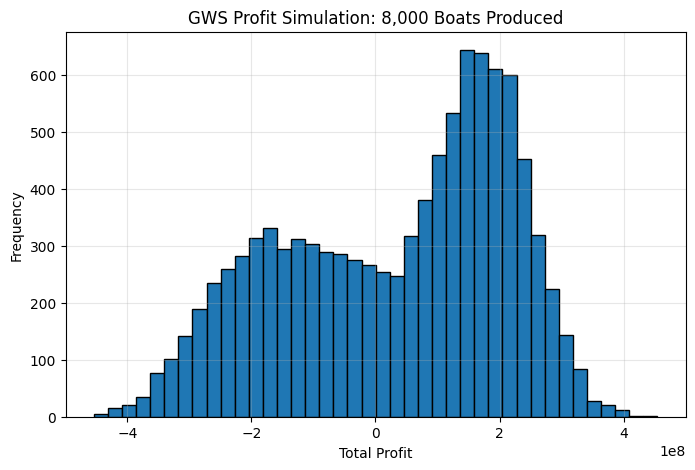
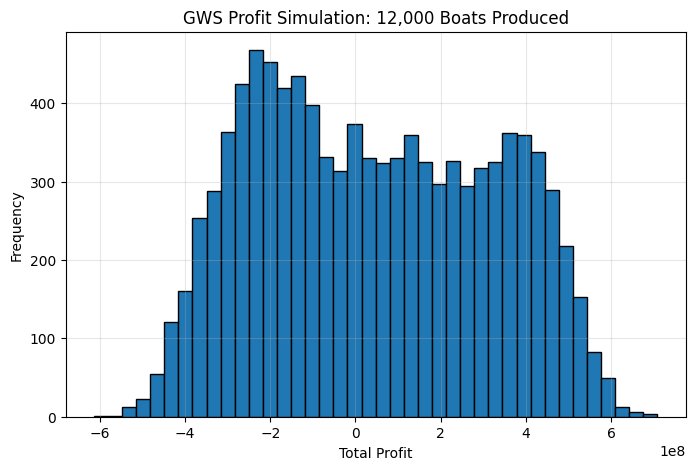
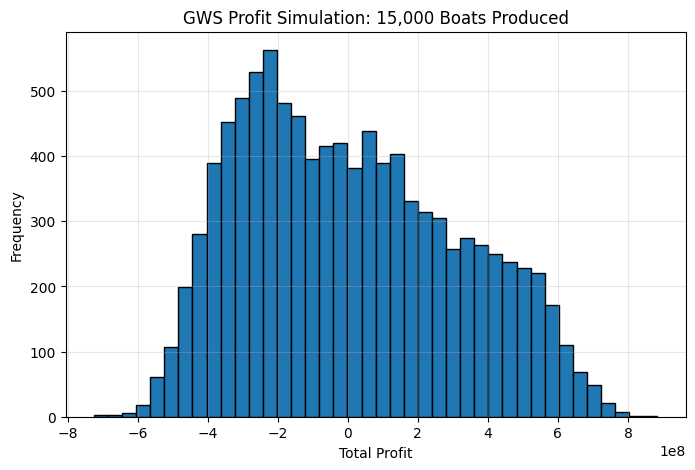
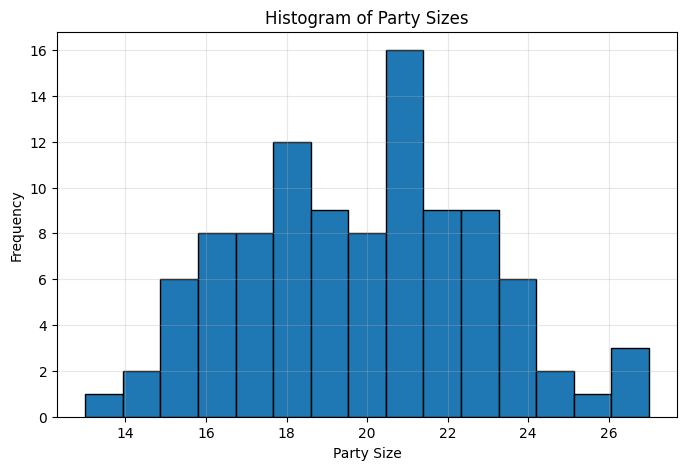
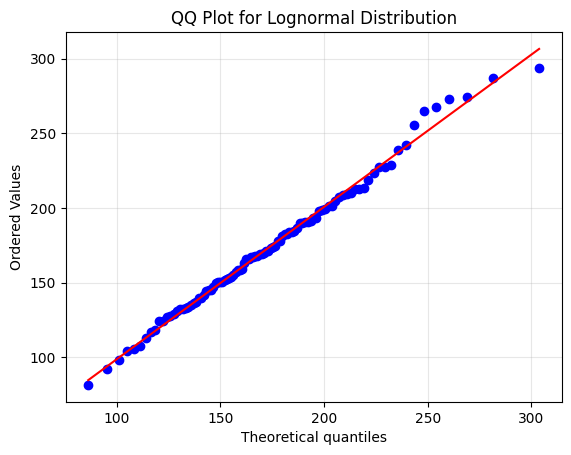
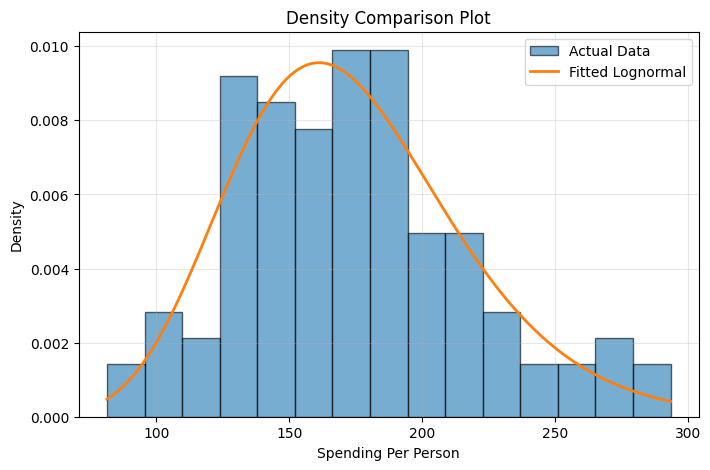
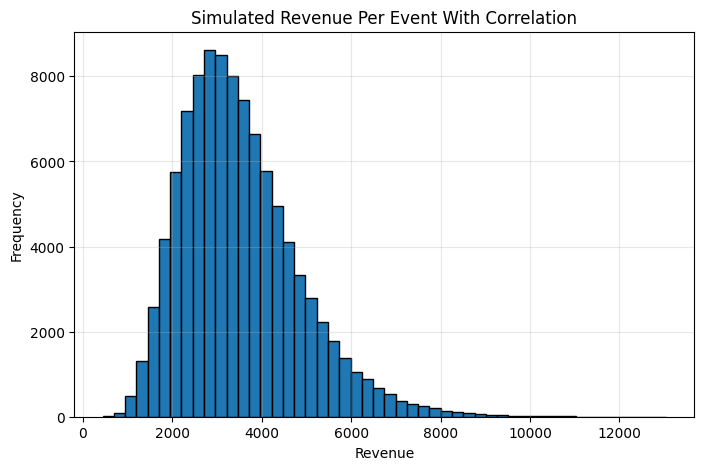
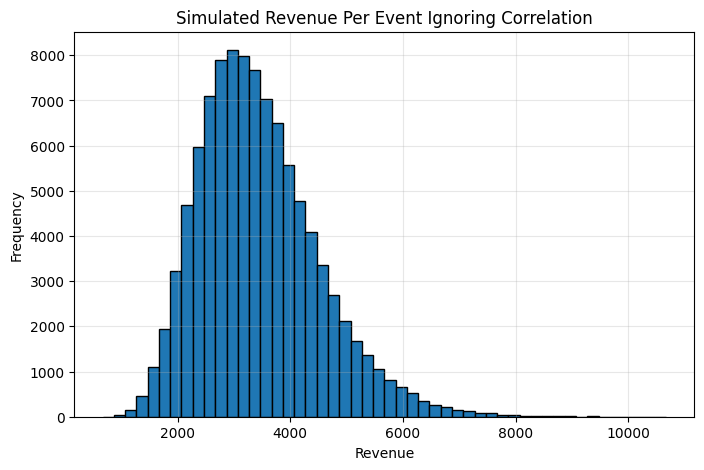
[These are some of the graphs that were created for this assignment]
Link: Assignment 3 GitHubAssignment 4
Assignment 4
Assignment description: This assignment focused on simulation optimization and decision analysis under uncertainty by applying Monte Carlo methods to optimize complex business decisions. The first case expanded the GWS Electric Boats model by evaluating production strategies across multiple scenarios, generating confidence interval ribbon plots and profit density distributions, and identifying the optimal production level based on expected profit, downside risk, and the probability of achieving a target profit. The second case developed an investment allocation model for a venture capital firm, simulating correlated returns from competing startups using a Gaussian copula and lognormal distributions while incorporating taxes, guaranteed investment alternatives, and liquidity constraints. Simulation optimization was used to determine the investment strategy that maximized expected profit both with and without risk constraints. Throughout the assignment, Monte Carlo simulation, optimization techniques, statistical visualization, and risk analysis were applied to support data-driven decision-making in uncertain business environments.
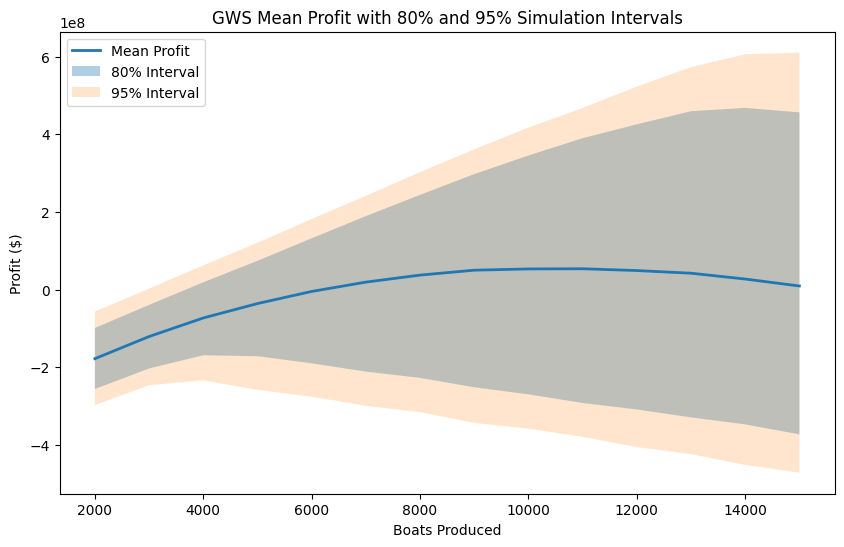
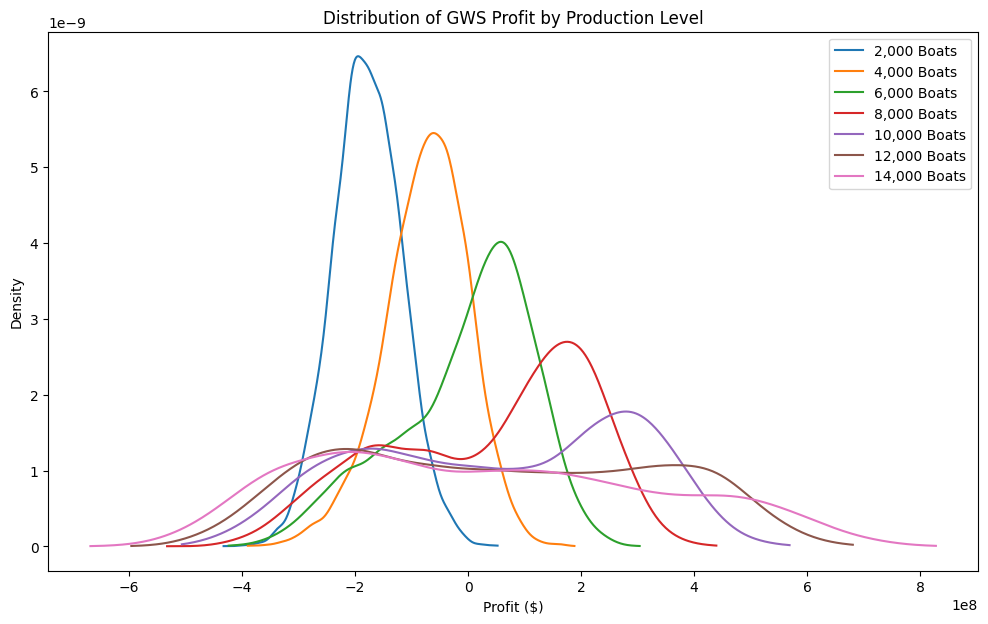
[These are some of the graphs that were created for this assignment]
Link: Assignment 4 GitHubAssignment 5
Assignment 5
Assignment description: This assignment focused on Bayesian decision analysis and Bayesian inference to support decision-making under uncertainty. The first case evaluated multiple real estate investment strategies using Bayes’ Theorem, expected value analysis, and decision trees to compare purchasing options, consultant recommendations, and campaign scenarios while incorporating updated probabilities and financial risk. The second case applied Markov Chain Monte Carlo (MCMC) methods to estimate the posterior distribution of an unknown stock return using historical market data and Bayesian statistics. Posterior means, 95% credible intervals, and distribution visualizations were generated to quantify uncertainty and compare prior beliefs with observed evidence. Throughout the assignment, Bayesian probability, decision analysis, MCMC simulation, statistical inference, and data visualization were used to demonstrate how probabilistic models can improve financial forecasting and strategic decision-making under uncertainty.
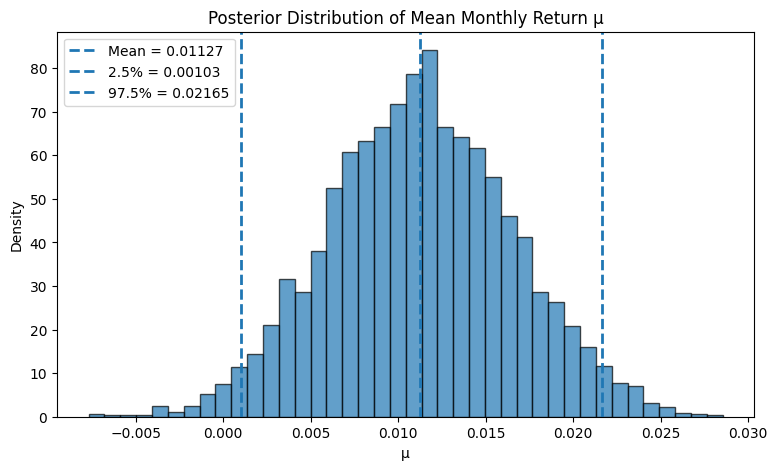
[These are some of the graphs that were created for this assignment]
Link: Assignment 5 GitHubBusiness Analytics Foundations
Assignment 1
Assignment 1
Assignment description: This assignment focused on analyzing New York City residential real estate market trends using Power BI and data from the Boston University SQL Server. The project examined five years of property sales data at the city, borough, and neighborhood levels, with a detailed case study of Bay Ridge, Brooklyn. Interactive dashboards and visualizations were developed to evaluate changes in sale prices, price per square foot, transaction volume, property type distributions, and long-term market trends. The analysis concluded with a business recommendation by estimating potential real estate commission revenue under different market penetration assumptions while assessing investment risk based on historical market performance. The project demonstrated skills in business intelligence, dashboard development, exploratory data analysis, KPI reporting, and translating data into actionable business recommendations.
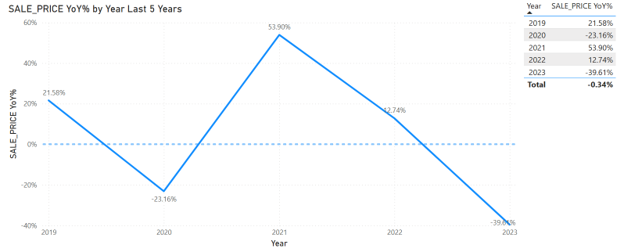
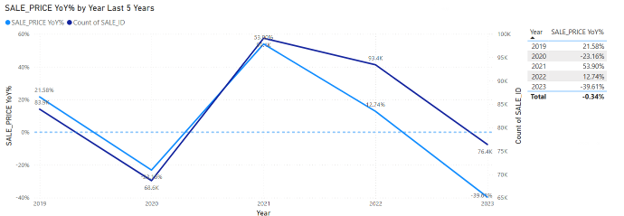
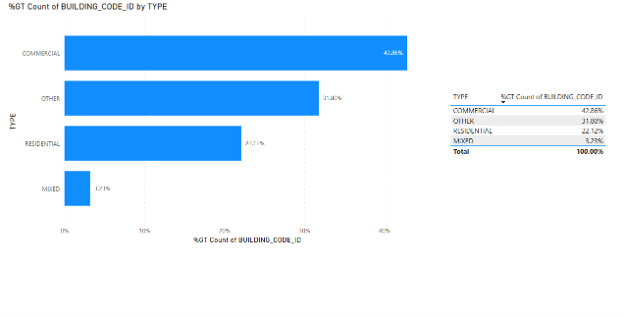
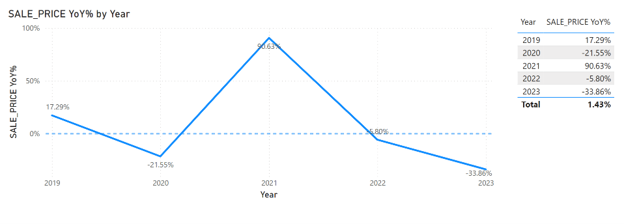
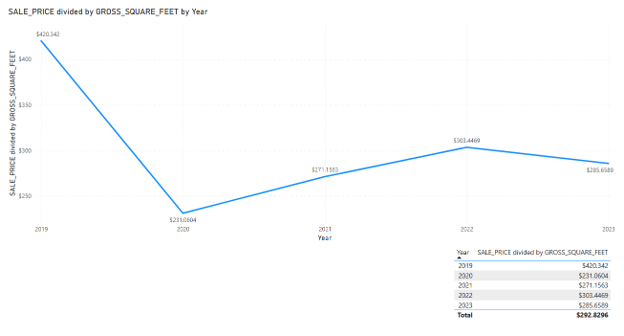
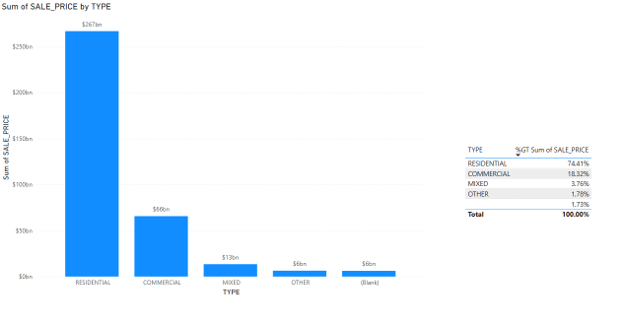
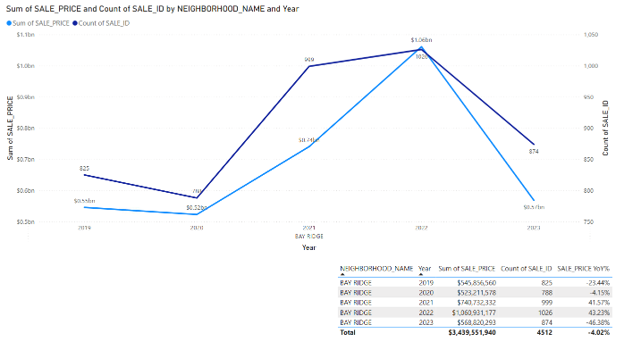
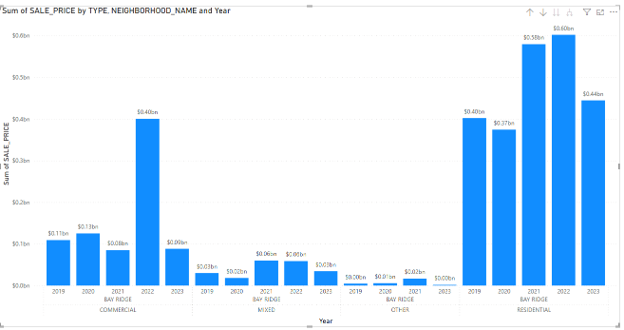
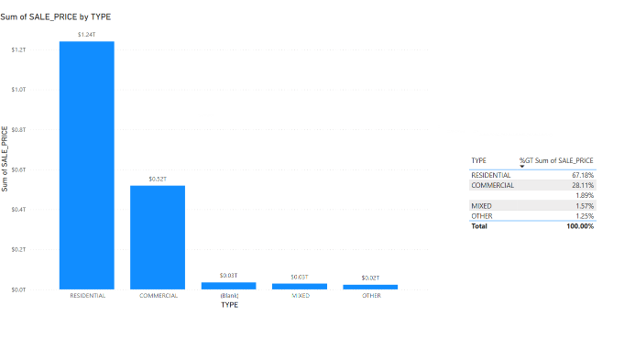
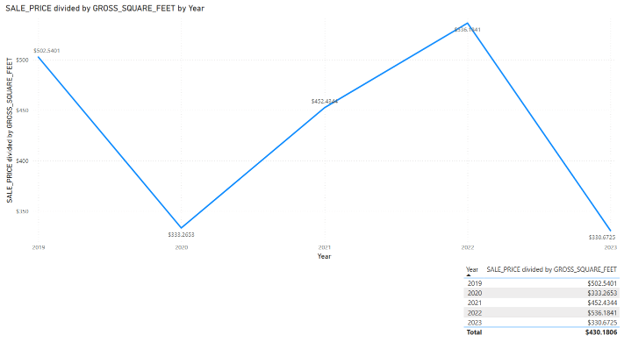
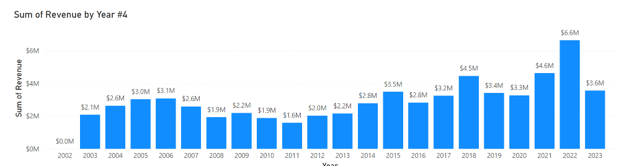
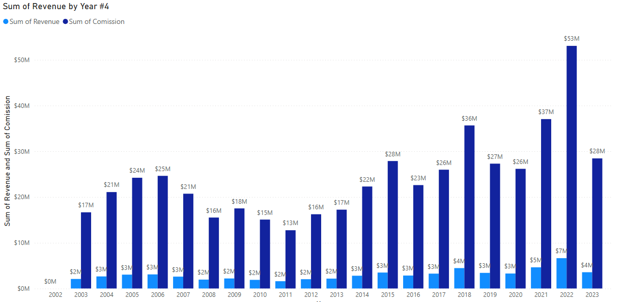
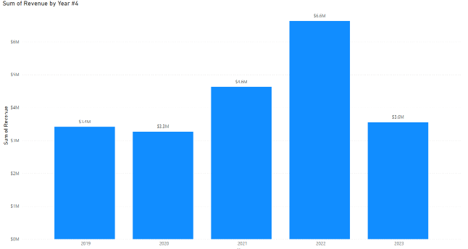
[These are some of the graphs that were created for this assignment]
Link: Assignment 1 GitHubAssignment 2
Assignment 2
Assignment description: This assignment focused on analyzing long-term residential real estate trends in Bay Ridge, Brooklyn using RStudio and Microsoft Excel. The project examined over 20 years of property sales data to evaluate changes in average price per square foot, annual growth rates, and overall market performance. Time-series visualizations were created to identify historical trends and compare Bay Ridge’s growth against neighboring communities within Brooklyn as well as neighborhoods across New York City. The analysis assessed long-term market performance, regional competitiveness, and future investment potential by identifying patterns in property values and comparing neighborhood growth trajectories. The project demonstrated skills in data analysis, statistical visualization, trend analysis, comparative market analysis, and translating historical real estate data into actionable business insights.
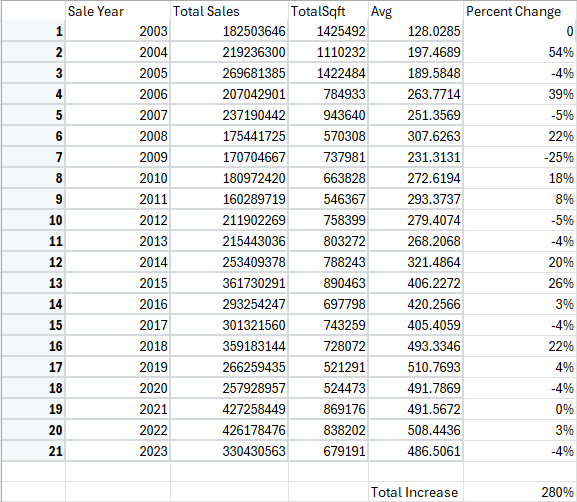
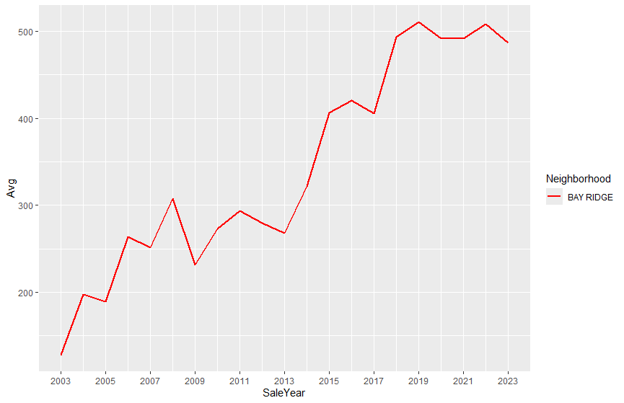
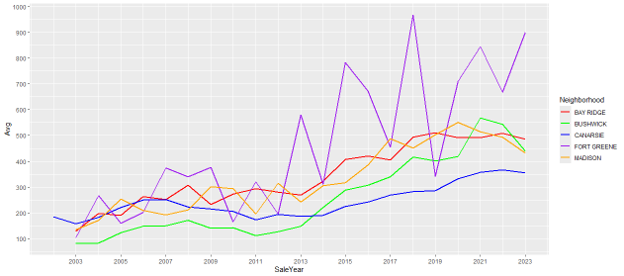
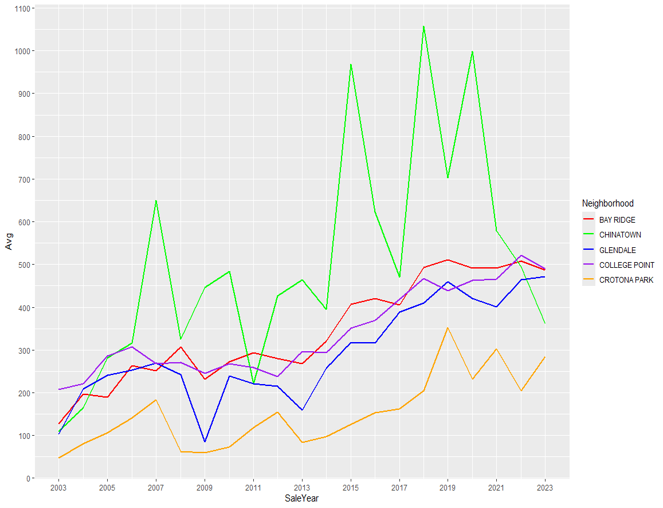
[These are some of the graphs that were created for this assignment]
Link: Assignment 2 GitHubAssignment 3
Assignment 3
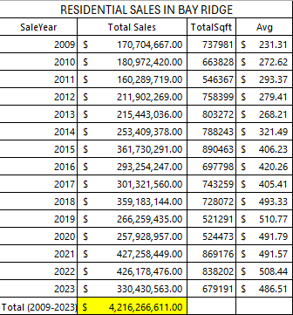
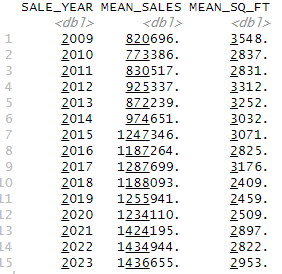
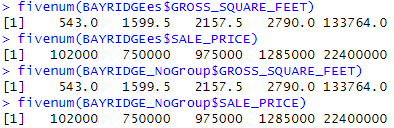
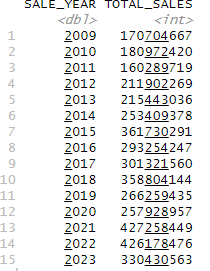
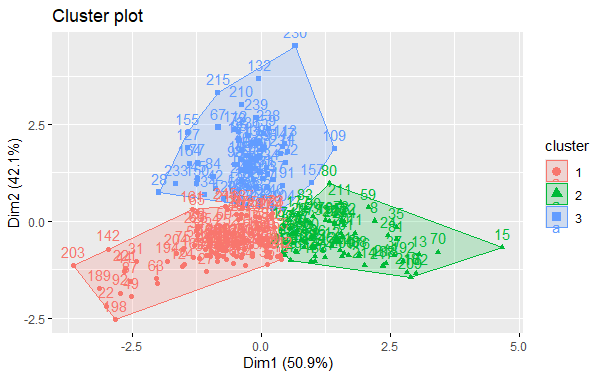
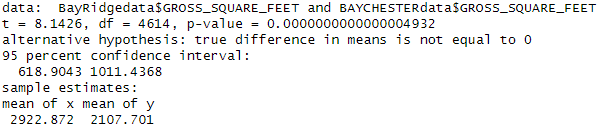
Assignment description: This assignment focused on applying advanced statistical analysis to evaluate the residential real estate market in Bay Ridge, Brooklyn using RStudio. The project combined descriptive statistics, K-Means clustering, and hypothesis testing (t-tests) to assess market performance, identify investment opportunities, and compare Bay Ridge with other New York City neighborhoods. Key performance indicators—including sale price, price per square foot, transaction volume, and property size—were analyzed to uncover market trends and segment neighborhoods into distinct investment profiles. Correlation analysis, five-number summaries, and measures of variability were used to evaluate market volatility, while clustering techniques identified neighborhoods with similar market characteristics. The project concluded with statistical hypothesis testing to validate significant differences in residential property values between neighborhoods, demonstrating the use of statistical modeling, market segmentation, and inferential analysis to support data-driven real estate investment decisions.
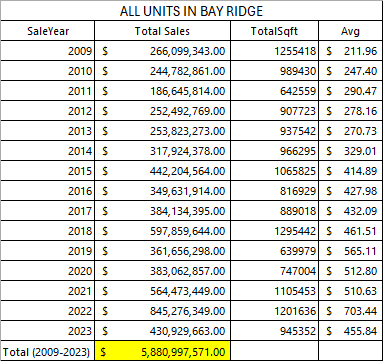


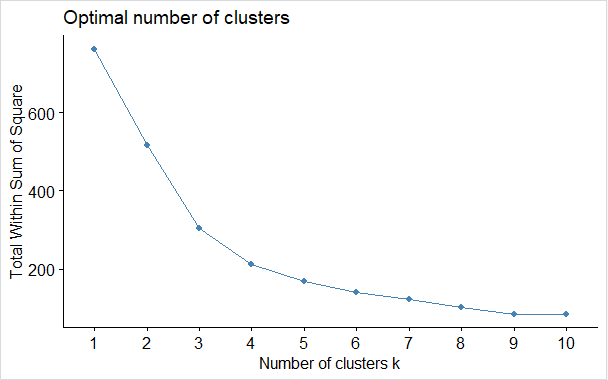
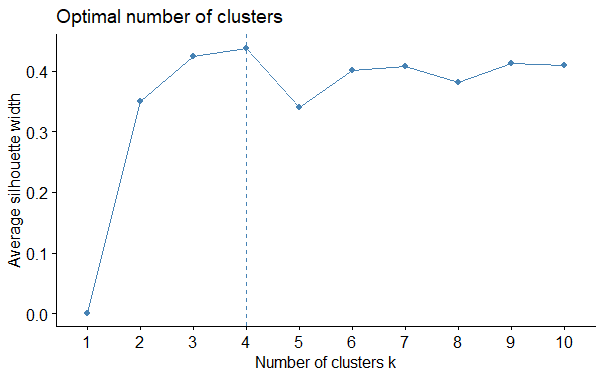
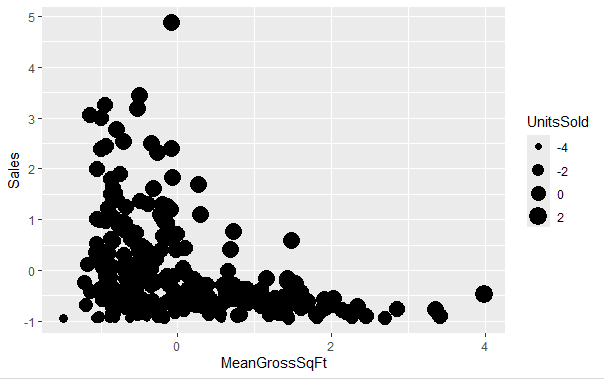
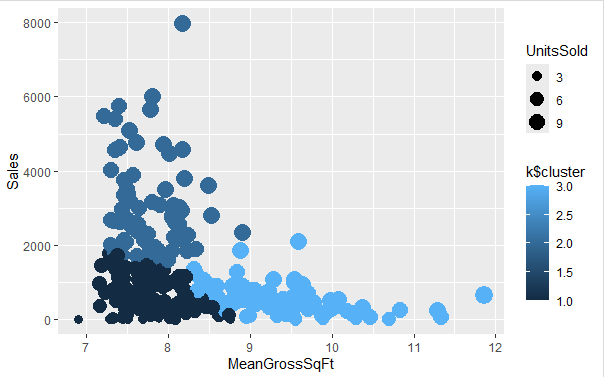


[These are some of the graphs that were created for this assignment]
Link: Assignment 3 GitHubAssignment 4
Assignment 4
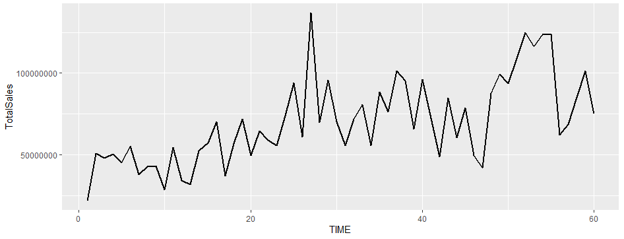
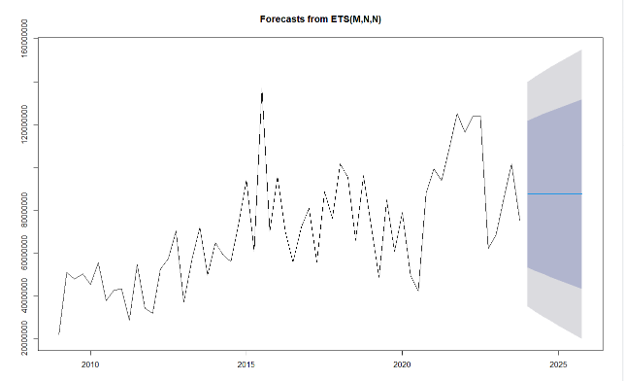
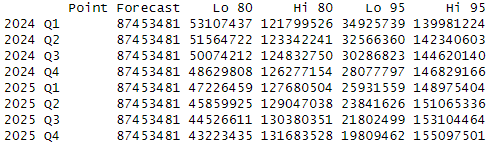
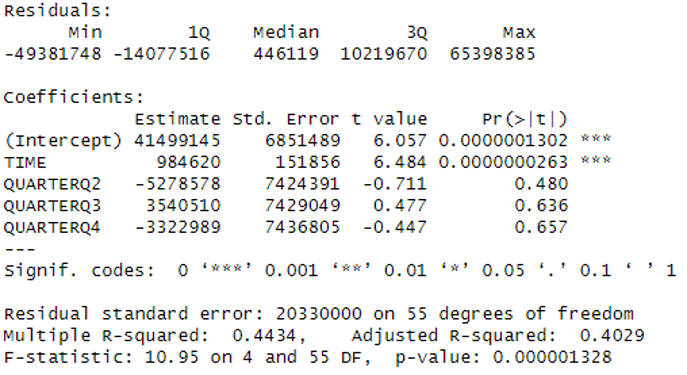
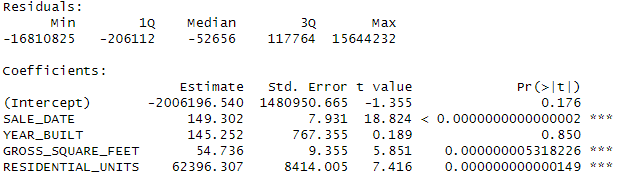
Assignment description: This assignment focused on applying time series forecasting and multiple regression analysis to evaluate and predict residential real estate trends in Bay Ridge, Brooklyn using RStudio. The project developed forecasting models to analyze historical sales activity, estimate future market performance, and assess seasonal trends over an eight-quarter period. A multiple regression model was then used to identify the key factors influencing property sale prices, including residential units, year built, gross square footage, and sale date. By comparing predicted and actual property values, the analysis identified potentially overvalued properties and undervalued investment opportunities based on model residuals. The project demonstrated practical applications of predictive analytics, regression modeling, forecasting, and data-driven decision-making to evaluate market trends and identify strategic real estate investment opportunities.
[These are some of the graphs that were created for this assignment]
Link: Assignment 4 GitHubAssignment 5
Assignment 5
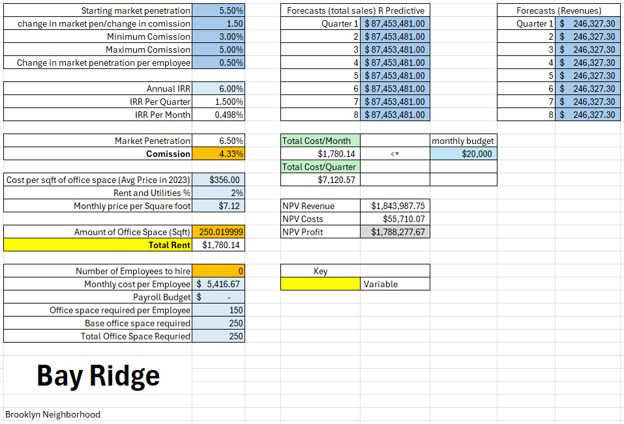
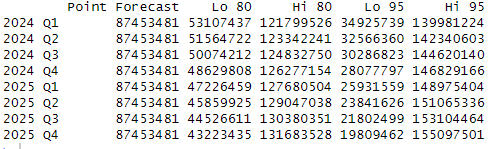
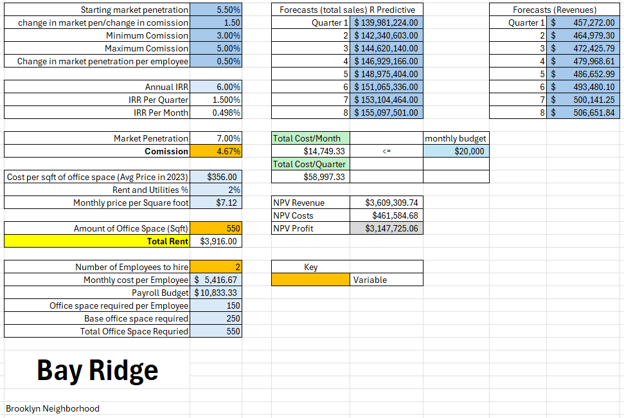
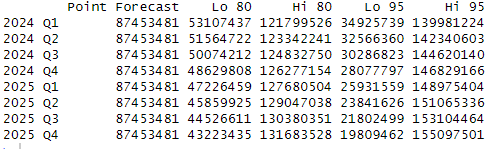
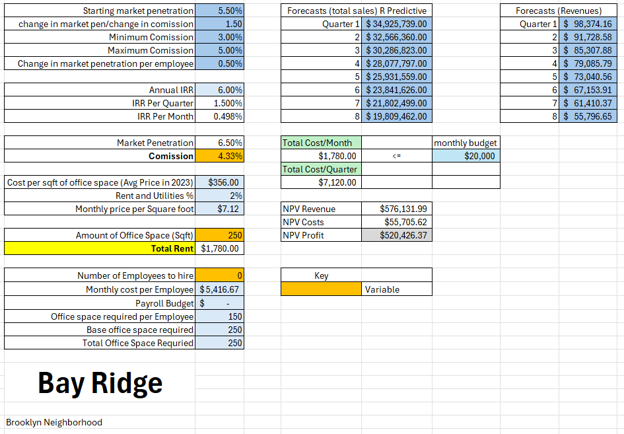
Assignment description: This assignment focused on business optimization by integrating predictive analytics with optimization modeling to develop a strategic expansion plan for a real estate company in Bay Ridge, Brooklyn. Historical market data was analyzed in RStudio to generate sales forecasts, which were then incorporated into a Microsoft Excel optimization model to maximize Net Present Value (NPV) over an eight-quarter planning horizon. The model evaluated trade-offs between commission rates, staffing levels, office space requirements, operating costs, and market penetration under base, high-growth, and low-growth forecast scenarios. By comparing multiple business strategies and operational constraints, the project identified the optimal combination of staffing and commission rates for different market conditions. The assignment demonstrated practical applications of forecasting, optimization, financial modeling, scenario analysis, and data-driven strategic decision-making to maximize long-term business profitability.
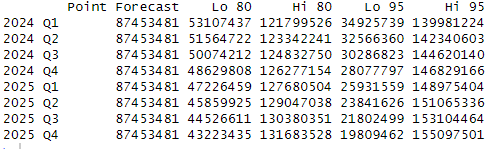
[These are some of the graphs that were created for this assignment]
Link: Assignment 5 GitHubFinal Presentation
Final Presentation
Assignment description: This capstone project integrated descriptive, predictive, and prescriptive analytics to evaluate the feasibility of expanding a real estate brokerage into Bay Ridge, Brooklyn. Historical residential real estate data was analyzed using RStudio and Microsoft Excel to assess market conditions, forecast future sales, and develop an optimization strategy for business growth. Descriptive analytics included market trend analysis, K-Means clustering, correlation analysis, and hypothesis testing to evaluate neighborhood characteristics and investment potential. Predictive analytics utilized time series forecasting and multiple regression models to identify key drivers of property values and project future market performance. Finally, prescriptive analytics combined forecasting with optimization techniques to determine the ideal commission structure, staffing levels, market penetration, and operating strategy that maximized Net Present Value (NPV) under multiple market scenarios. The project demonstrated an end-to-end analytics workflow, showcasing skills in business intelligence, statistical analysis, predictive modeling, optimization, financial decision-making, and strategic business recommendations.
Link: Assignment 5 GitHub