Our team conducted an overview of our current technical skills when it comes to Business Analytics and our skill levels. The goal was to understand where the group’s strengths and weaknesses were and understand how the data that was collected could relate to the data that was observed in the research conducted. This was used to identify strengths and weaknesses for the group while also identifying potential gaps within the group.
Code
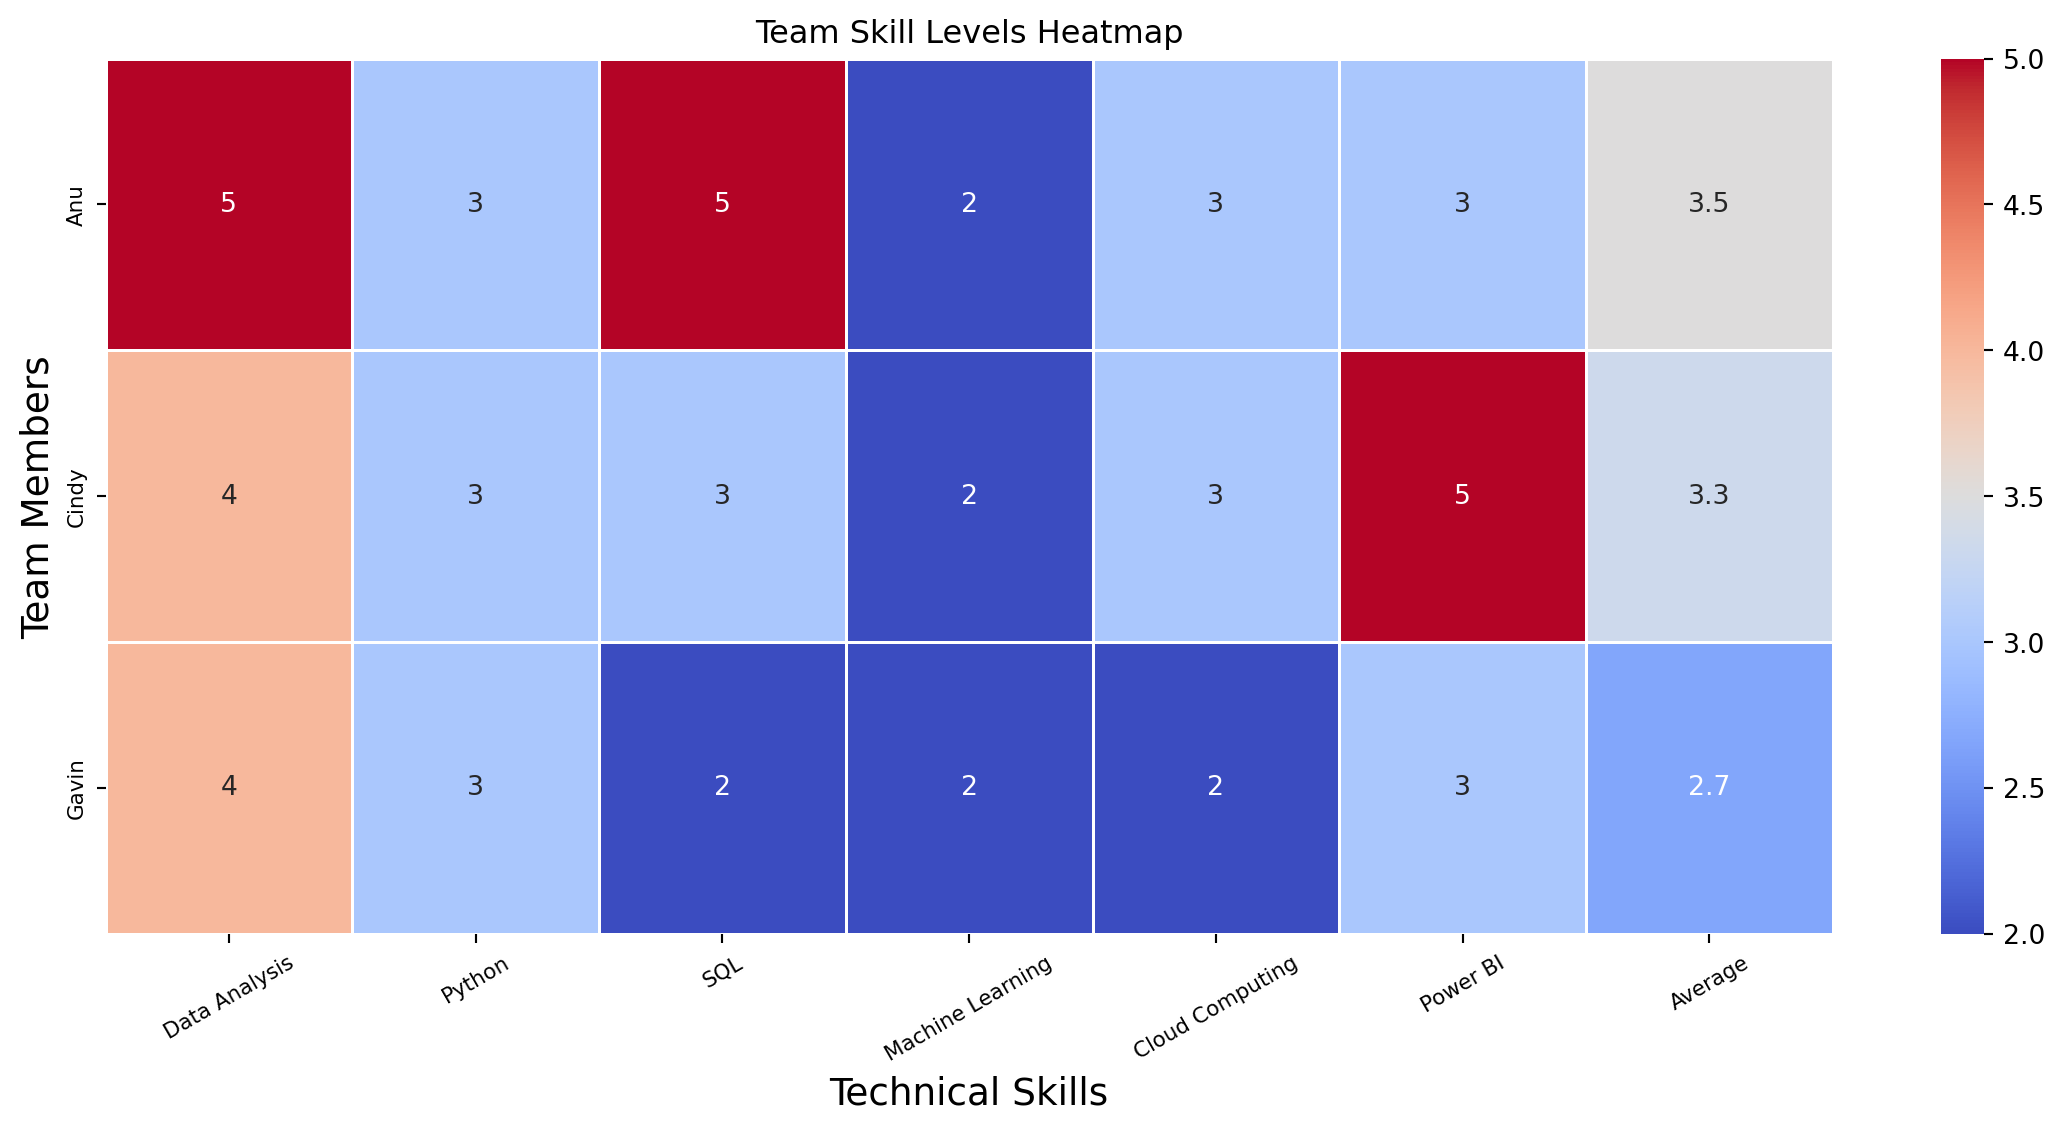
import pandas as pd# Extended skills dataskills_data = {"Name": ["Anu", "Cindy", "Gavin"],"Data Analysis": [5, 4, 4],"Python": [3, 3, 3],"SQL": [5, 3, 2],"Machine Learning": [2, 2, 2],"Cloud Computing": [3, 3, 2],"Power BI": [3, 5, 3],}# Create DataFrame and set indexdf_skills = pd.DataFrame(skills_data).set_index("Name")# Ensure all columns are numericdf_skills = df_skills.apply(pd.to_numeric)# Add the Average rowdf_skills["Average"] = df_skills.mean(axis=1)# Style with borders and centered textdf_styled = df_skills.style.set_table_styles([ {'selector': 'th, td', 'props': [('border', '1px solid black'), ('text-align', 'center')]}])# df_styled
When looking at the heatmap it shows that our team still feels relatively new to these technical skills and highlighted in blue are the most notable areas for growth. One person in our group is a Business Analyst while the other two do not use these tools on a daily basis and due to this lack of exposure is likely to contribute to a lack of technical skill observed in the heatmap. Increased exposure and experience outside of an educational setting could contribute to increased technical skills within the group.
Data Analysis represents the strongest skill that our group presents, while this isn’t a program it was noted as one of the top skills that impacted salary, alongside experience and being remote. Regardless of the type of data analysis experience, having the ability to analyze data is more vital according to the data represented in the ML Model section of this website. Having a core analytical ability puts our group ahead of most candidates that have vast python experience depending on the types of jobs that they are looking to apply for, and adding the other analytical tools such as Python and Power BI only empower our group further in the ability to find higher paying jobs.
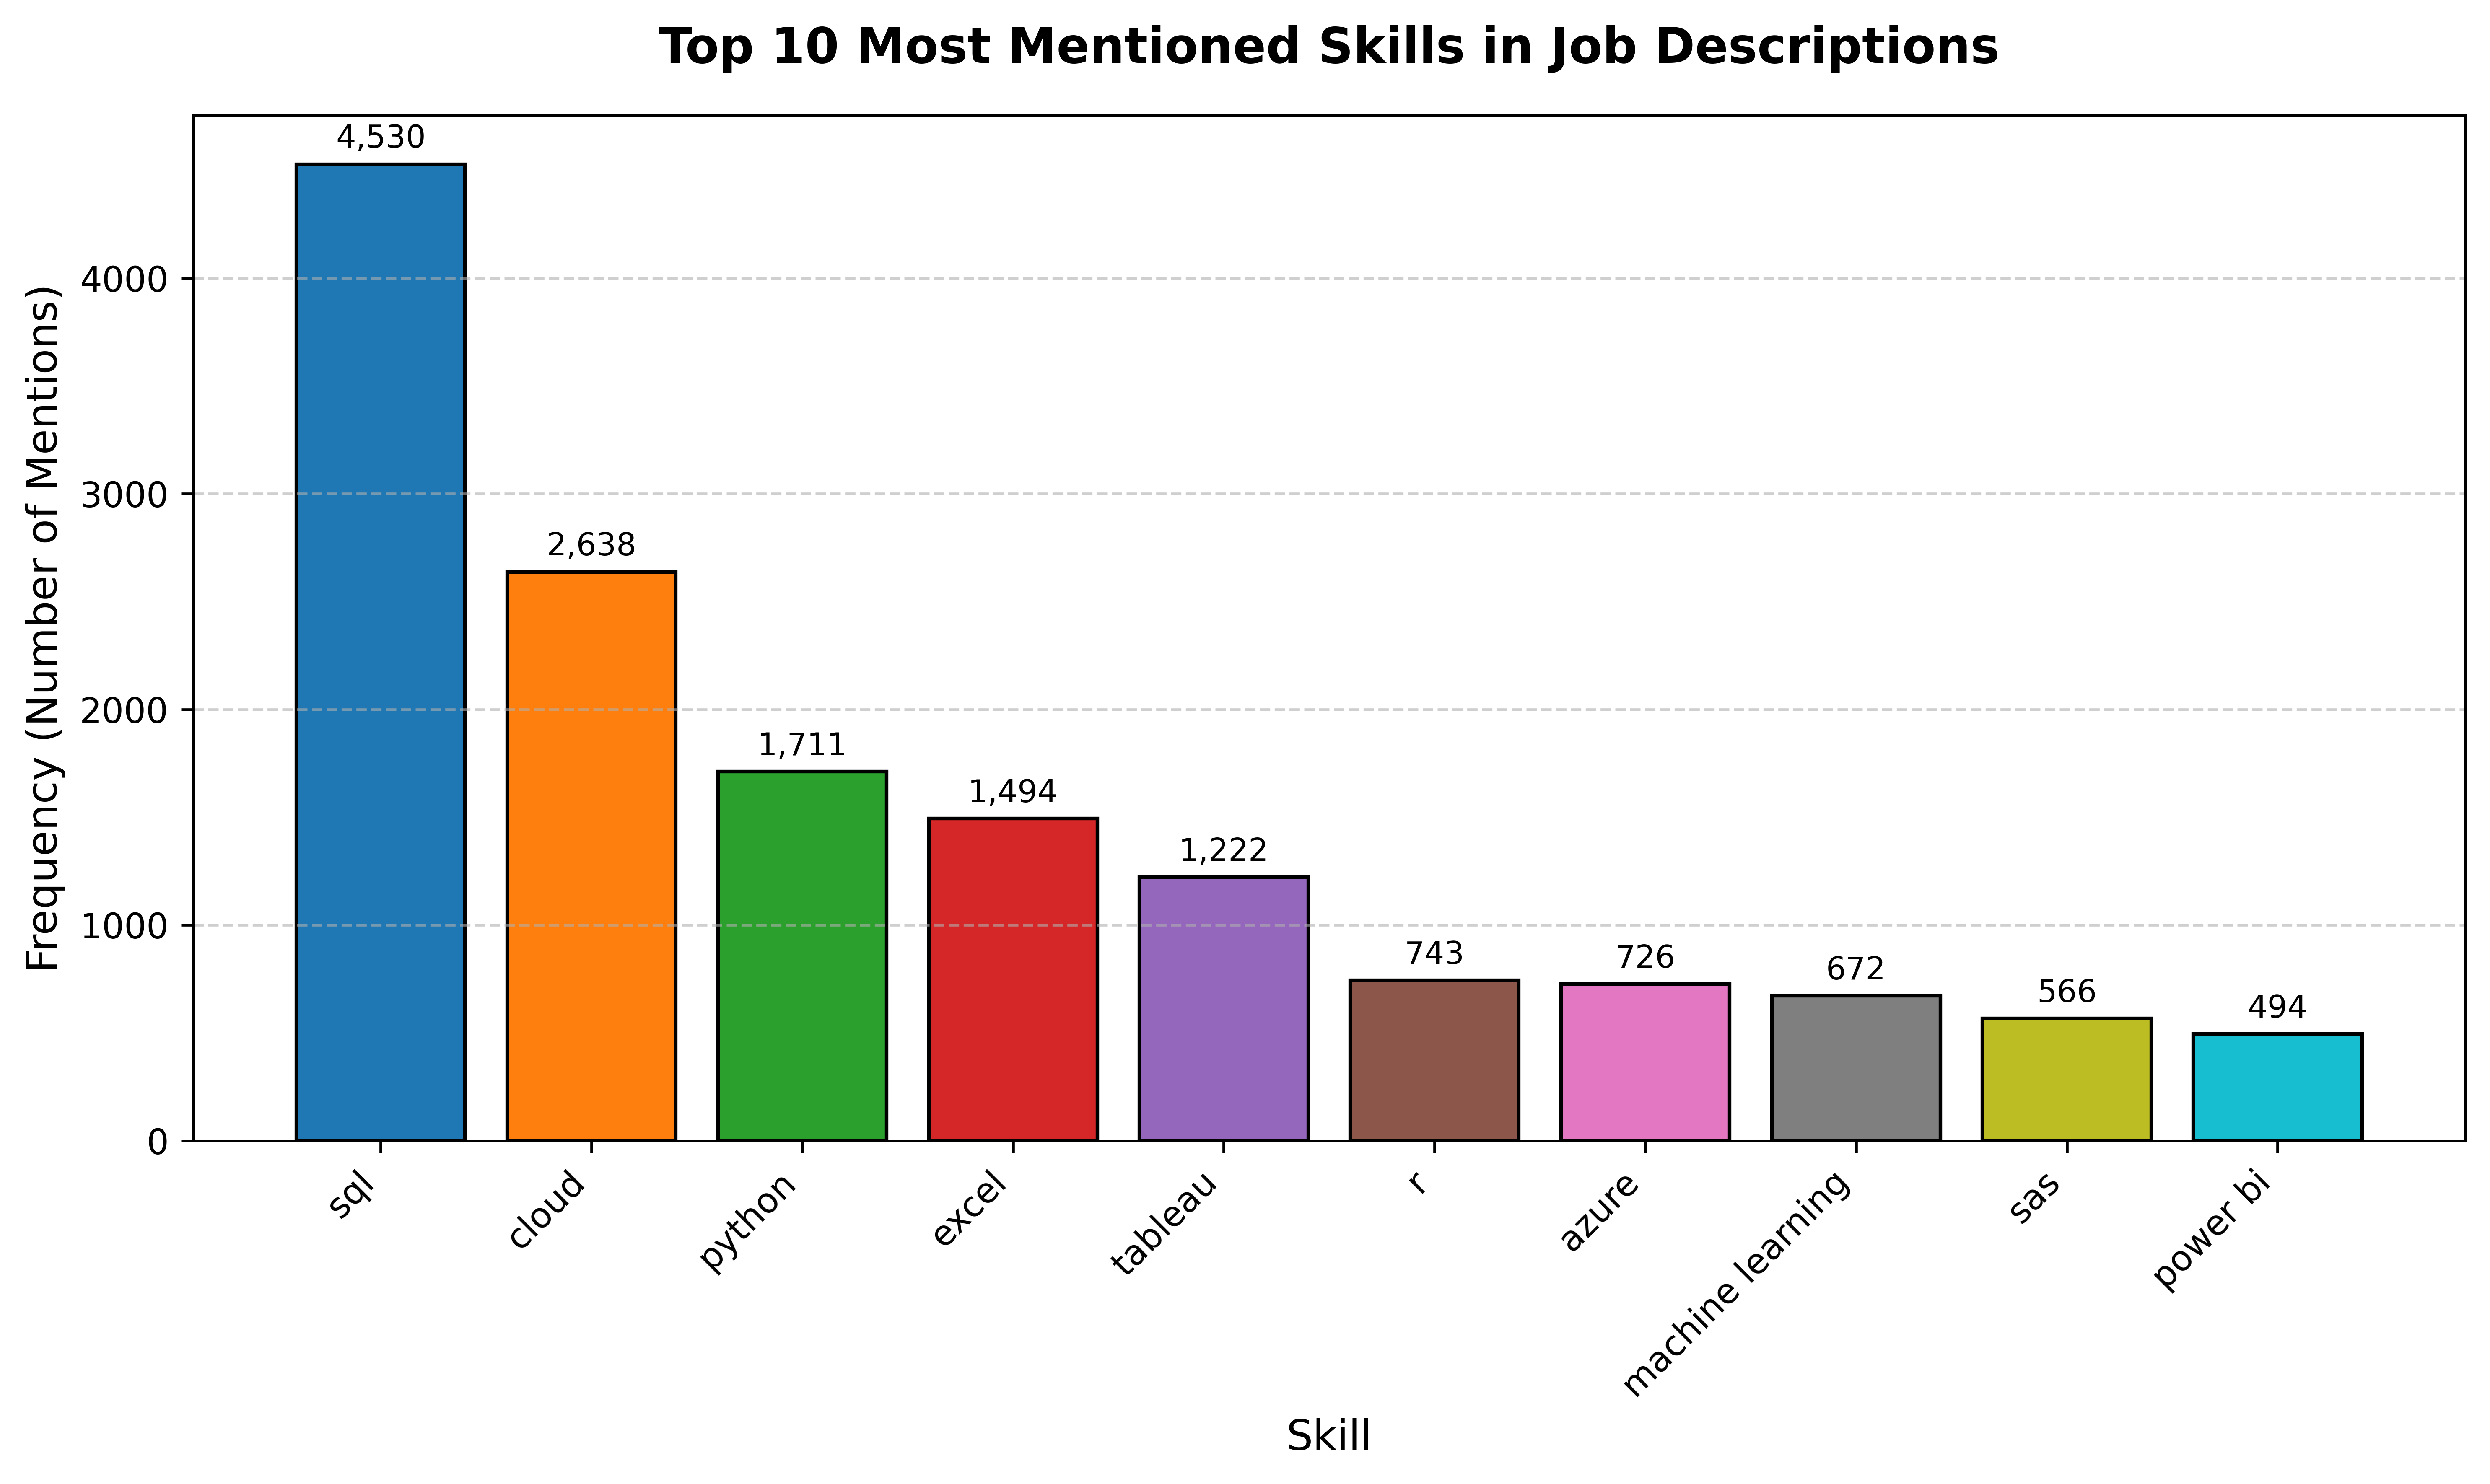
Power BI is our second strongest skill as a group, and while this isn’t a program that is used within the program it was also ranked number 10 when looking at the number times it was mentioned in job descriptions. As can be seen lower on this page it was mentioned 494 times. This is still a strong skill as it can be used in combination with other Microsoft suite programs such as Excel which had a count of 1494 in job descriptions. These, in combination with each other can help in qualifying for a greater number of jobs. Excel was excluded from the list of skills to conform to size but is without question also a valuable technical skill.
Python is also a strong skill across the team and this is likely in large part due to the exposure that has occurred during this course, while no one in the group are experts in Python our technical skill levels indicate that we have a foundational understanding of the programming language and are able to navigate the complexities and manipulate data in order to meet organizational goals and objectives required for data analysis, automation, and model development that was observed during this course.
Cloud Computing was one of the areas where we struggled as a group and this was in large part due to a lack of exposure and could likely increase in environments where this was utilized like our educational environment like this class.
3 Most in demand skills ranked
Code
# Skill Key Wordsimport pandas as pdimport refrom collections import Counter# Define the skills we are looking forskills_keywords = ["python", "sql", "machine learning", "cloud", "aws", "azure","docker", "java", "excel", "r", "linux", "tableau", "power bi","spark", "hadoop", "javascript", "c++", "pandas", "numpy"]# Compile regex patterns for faster matchingpattern_dict = {skill: re.compile(rf"\b{re.escape(skill)}\b") for skill in skills_keywords}# Initialize a counter to store matchesskill_counts = Counter()# Read the CSV in chunks to avoid memory overloadchunk_size =10000# You can adjust this if your EC2 has more memoryfor chunk in pd.read_csv("data/lightcast_cleaned.csv", usecols=["BODY"], chunksize=chunk_size, on_bad_lines="skip", # <-- skip broken lines instead of crashing engine="python", # <-- slower but handles messy text safely encoding="utf-8", # <-- explicitly set encoding sep=",", # <-- enforce comma delimiter quoting=3# <-- ignore quote mismatches): chunk = chunk["BODY"].dropna().str.lower()# For each job description, count skill occurrencesfor text in chunk:for skill, pattern in pattern_dict.items(): skill_counts[skill] +=len(pattern.findall(text))top_skills = skill_counts.most_common(5)import pandas as pd# Convert Counter to DataFrameskills_df = pd.DataFrame(skill_counts.items(), columns=["Skill", "Count"])# Optional: sort by count descendingskills_df = skills_df.sort_values(by="Count", ascending=False).reset_index(drop=True)skills_df.head(10)
Skill
Count
0
sql
4530
1
cloud
2638
2
python
1711
3
excel
1494
4
tableau
1222
5
r
743
6
azure
726
7
machine learning
672
8
power bi
494
9
java
473
Code
import matplotlib.pyplot as pltimport numpy as npskills, counts =zip(*skill_counts.most_common(10))# Make figure taller for vertical bars, and increase quality of graphicplt.figure(figsize=(10, 6), dpi=300)# Unique color per barcolors = plt.cm.tab10(np.linspace(0, 1, len(skills)))# Plot vertical barsbars = plt.bar(skills, counts, color=colors, edgecolor="black")# Titles and labelsplt.title("Top 10 Most Mentioned Skills in Job Descriptions", fontsize=14, fontweight="bold", pad=15)plt.xlabel("Skill", fontsize=12)plt.ylabel("Frequency (Number of Mentions)", fontsize=12)# Rotate x labels for readabilityplt.xticks(rotation=45, ha="right", fontsize=10)plt.yticks(fontsize=10)# Add values on top of barsfor bar in bars: plt.text(bar.get_x() + bar.get_width()/2, bar.get_height() +max(counts)*0.01,f"{bar.get_height():,}", ha="center", va="bottom", fontsize=9, color="black")# Gridlines and layoutplt.grid(axis="y", linestyle="--", alpha=0.6)plt.tight_layout()plt.show()
4 Addressing Skill Gaps
When looking at our group’s skill gaps, the group should focus on our weakest points which are Cloud Computing and Machine Learning.
For Cloud Computing there are many programs that offer the ability to gain experience and knowledge on platform specific programs such as AWS, Azure, or Google Cloud Platform (GCP). These are just a few examples of ways that our group could continue to expand on their knowledge and grow their analytical toolkit to expand for the future and meet the ever-expanding requirements out in the job market. Cloud Computing is a great way to do it, as clouds are the highest noted keyword, indicating that there is increased work going on in the cloud. These programs can also include access to free tiers such as AWS, Azure or GCP to experiment, just like the EC2 we are using for this class currently!
For Machine learning our group is below average in technical skill level, with an average skill level of 2 out of 5. While this is mostly due to a lack of exposure, this can be overcome with practical exercises such as Datacamp, which states “Machine learning courses cover algorithms and concepts for enabling computers to learn from data and make decisions without explicit programming. Build your skills in NLP, deep learning, MLOps and more.” (DataCamp (2025)). This is a way to gain practical skills that can be translated into real world careers, but similar to how Power BI was mentioned above, Machine Learning is ranked on the lower end of the count when looking at Job Descriptions, which may just mean that these are less in demand jobs but not necessarily that they are lower paying jobs. This may not be as valuable a skill to learn as continuing to increase skills such as Python, Cloud, or SQL.
5 Comparing Top Job Market Skills
The Top 3 market skills include SQL, Cloud, and Python. When comparing our average skills (the last column of our heatmap) with these we can see that our group is about average in our perception of our technical skills, the top 3 jobs when it comes to description count. This again doesn’t indicate that these jobs have the highest pay as the ML Methods tab will indicate the correlation between skills and salary where this data just indicates the amount of time that the skill itself was referenced. Improving these abilities even further could open the ability to increase job opportunities for the future. This was roughly 60% of the job postings when looking at just these Top 3 skills, and even just having average skills will put you in the upper quartile of employable candidates if you have this skill available. This data was not broken down into the experience level required, as this would be more enlightening to the requirements of employability with these skills, but these are the most common terms associated.
6 Summary
When looking at our group, we still have improvements that can be done for our technical skills, but we have a good baseline for what the market is looking for in the job market and expanding on these skills as referenced above could give us an advantage in jobs in the future. There are many free alternatives to formal education methods to gain experience with these skills, and even on the job training is a good alternative to gain these experiences and get more proficient overall to improve overall. This class has given us a good baseline for improvement, and we will continue to refine our skills with outside education methods.